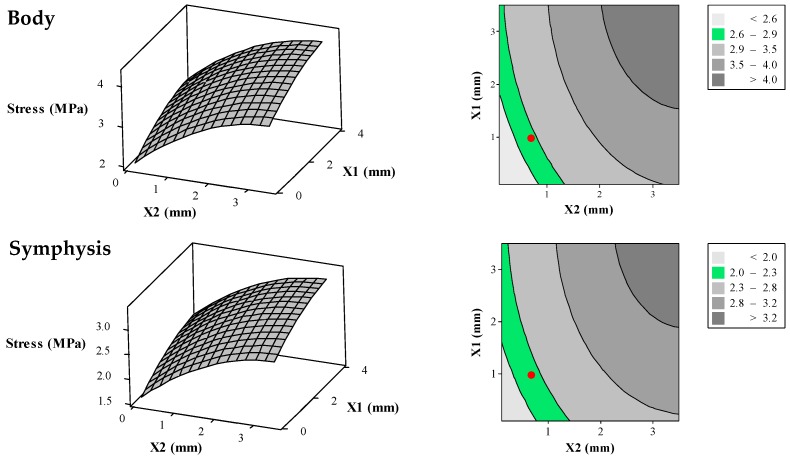
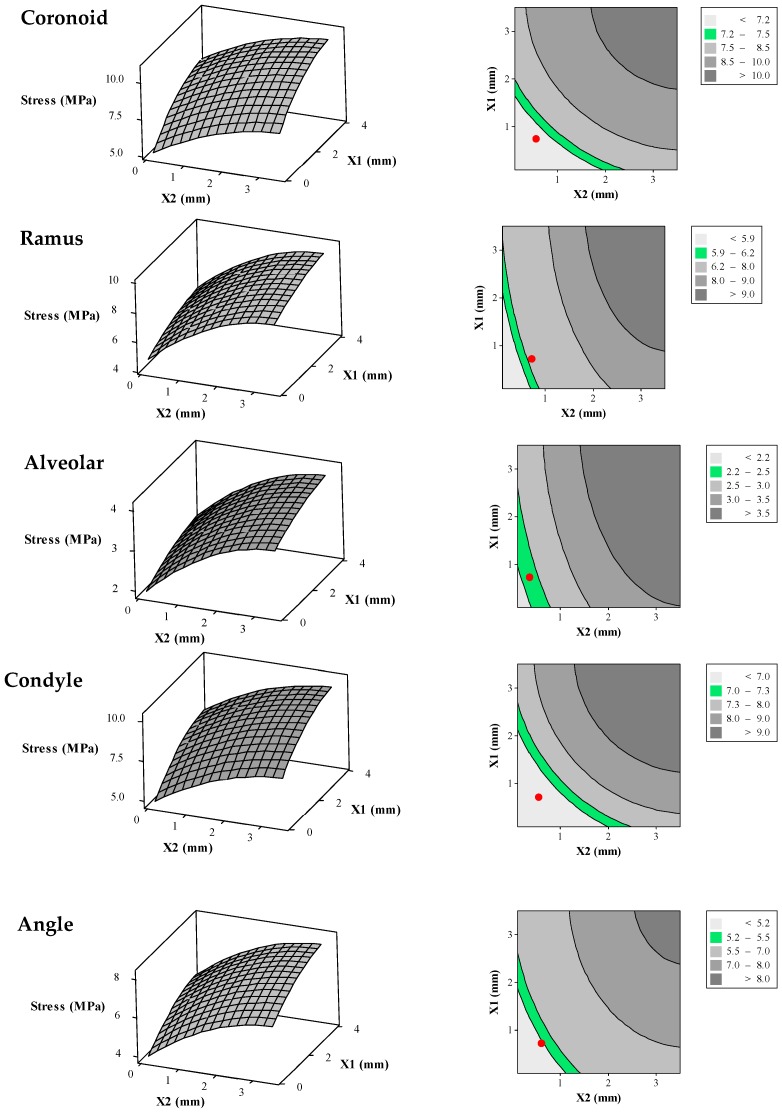
Figure 10.
Surface plots (left) and their corresponding contour plots (right) representing average von Mises stress in the different zones of the reconstructed mandible (i.e., alveolar, symphysis, body, angle, ramus, coronoid, and condyle) as a function of the diameters of superior and inferior wires of the Bone Bandaid apparatus. In the 2D contour plots (right), the desired ranges for the average von Mises stresses are presented as green areas. The red circles are representative for the average von Mises stresses resulting from the combination of optimized X1 = 1 mm and X2 = 0.65 mm.


