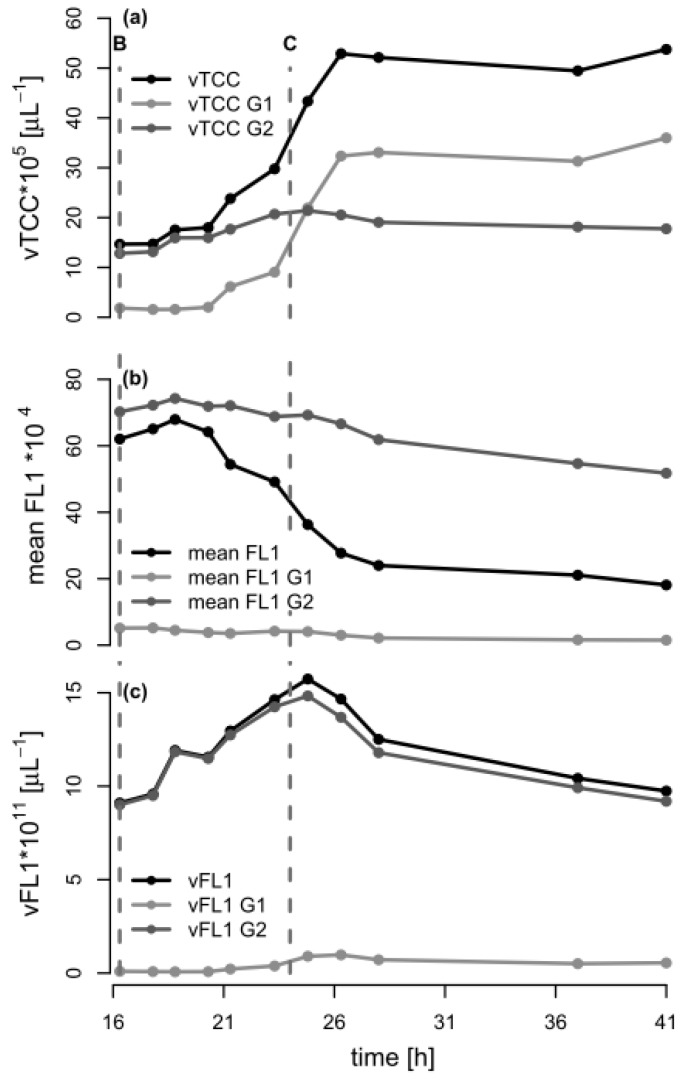
Figure 4.
Analysis of the flow cytometry (FCM) data during the depolymerization phase of the fed-batch experiment with P. putida KT2440 on octanoic acid (C8). The data from the FCM analysis during the second phase of fermentation (t = 16.3–41 h) are shown for the total population, as well as for the populations of gates G1 and G2 (low/no PHA and high PHA content, respectively). The dashed lines B and C indicate the time points when the C8 feeding was stopped and the ammonium pulse added (16.3 h), and when C8 was completely consumed (t = 24 h), respectively. (a) Volumetric total cell count (vTCC); (b) Mean FL1 fluorescence (PHA content); (c) Volumetric fluorescence (vFL1, computed by multiplying vTCC by FL1).

