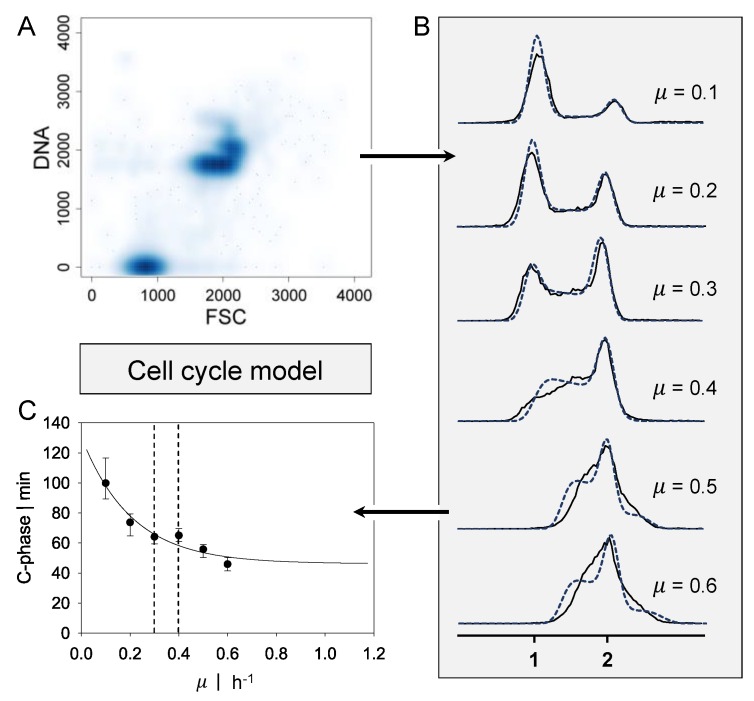
Figure 1.
Approach for the cell cycle dynamics model. (A) Representative flow cytometry scatter plot for deoxyribonucleic acid (DNA) content of the growth rate µ = 0.3 h−1. (B) DNA content over counts for growth rates ranging from µ = 0.1 h−1 up to µ = 0.6 h−1. A single genome is indicated by 1, and double chromosomes by 2. Black lines present experimental data, and blue dashed lines present the calculation of the cell cycle model. (C) Approximated C-phase duration over growth rate estimated by the cell cycle model (1% parameter covariance). Black dashed lines indicate the transition regime from single-forked to multiforked replication. Flow cytometry data obtained by Lieder et al. [6].

