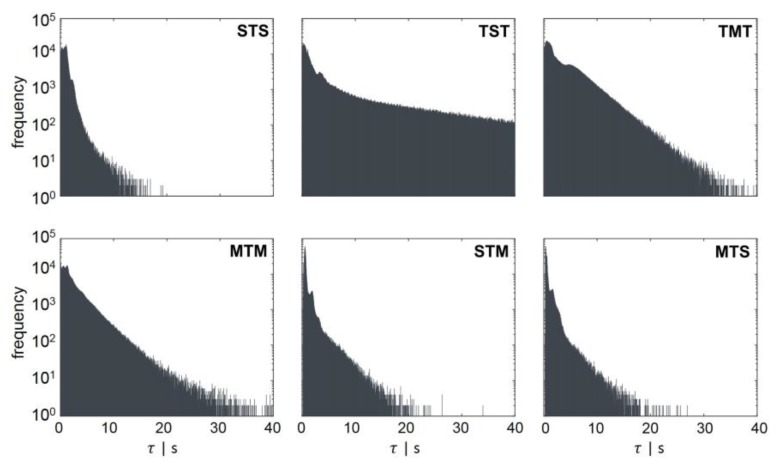
Figure 4.
Regime transition frequency as a function of the retention time . Regime transition classifications are indicated in the left corner of each panel. The second capital letter always indicates the area, in which the retention time was measured. The regime transition count for each retention time was scaled logarithmically.

