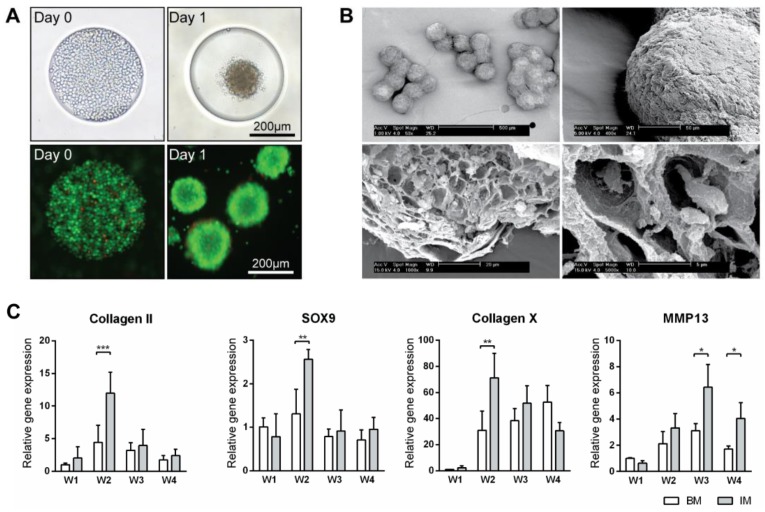
Figure 1.
Production of micro-tissue engineered cartilage (MiTEC). Cells were seeded on day 0 and the aggregate formed on day 1; the panel shows brightfield images (top row) and fluorescent images (bottom row) of cells staining with calcein (green) and ethidium homodimer-1 (red) (A). Scanning electron microscope images of MiTEC showed uniform size aggregates and cartilage-like lacunae (B). Gene expression profile of MiTEC cultured in basic medium (BM—white bar) and basic medium + ITS (IM—gray bar) at week 1–4 (C). Error bars represent standard deviation (n = 3). (*) denotes p < 0.05, (**) denotes p < 0.01, (***) denotes p < 0.001.

