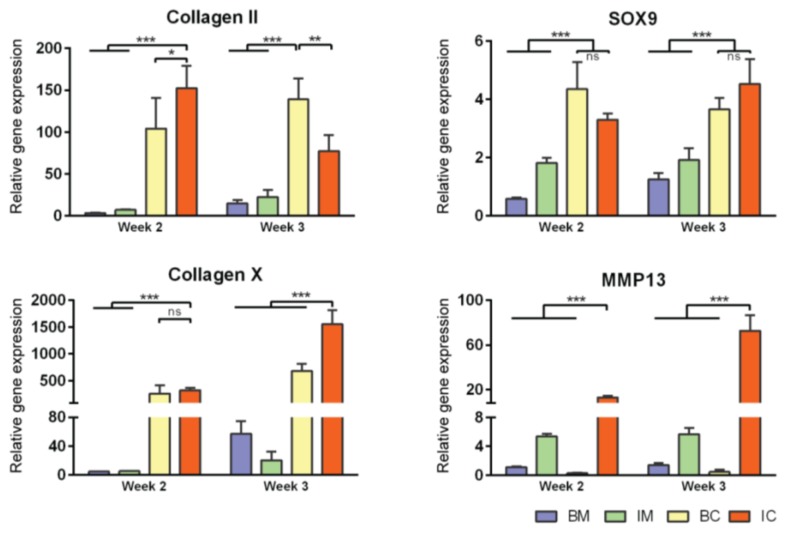
Figure 3.
Effect of different media on MiTEC gene expression. Gene expression analysis of aggregates cultured in basic medium (BM—blue bar), BM + ITS (IM—green bar), BM + TGFβ + Dex (BC—yellow bar), and BM + ITS + TGFβ + Dex (IC—red bar) at week 2–3. Error bars represent standard deviation (n = 3). (*) denotes p < 0.05, (**) denotes p < 0.01, (***) denotes p < 0.001, and ns denotes non-significant.

