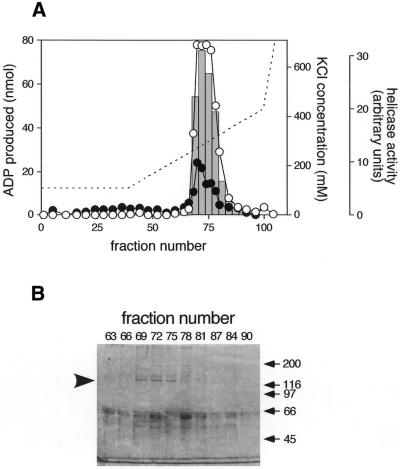
Figure 1.
Purification of DNA helicase B. (A) The elution profile of ATPase and DNA helicase activities on the second Mono Q column. Open and closed circles represent ATPase activity in 5 µl of second Mono Q fractions with and without 5 µg of heat-denatured DNA, respectively. Bars in the graph indicate DNA helicase activity in 0.5 µl of the fractions. 32P-labeled 21mer oligodeoxyribonucleotides liberated from M13mp19 single-stranded circular DNA were separated in a 12% polyacrylamide gel. The radioactivity of the liberated oligodeoxyribonucleotides was measured by BAS2000 (Fuji Photo Film) and plotted. A broken line indicates the KCl concentration calculated from the conductivity of the fractions. (B) SDS–PAGE of the Mono Q fractions. The eluted fractions (8 µl) were loaded onto a 7.5% SDS–polyacrylamide gel, and proteins were stained with Coomasie brilliant blue R-250. The arrowhead on the left of the gel indicates the position of the 130 kDa protein. Positions of molecular weight markers are indicated on the right.

