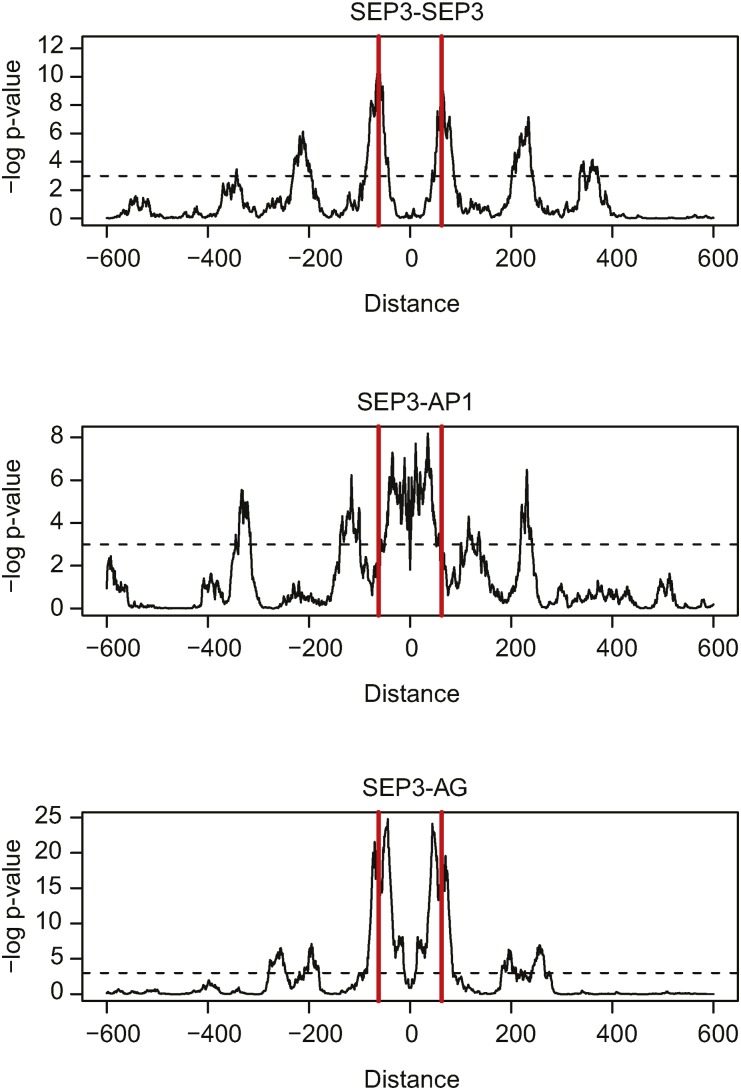
Figure 5.
Characteristics of SELEX-Seq Peaks within ChIP-Seq Peaks.
Distribution of complex specific SELEX-seq TFBSs within ChIP-seq TFBSs of SEP3 (top), AP1 (middle), and AG (bottom). Shown is the frequency of distances normalized by the background frequency distances outside of the ChIP-seq peaks, plotted based on the calculated P values using the hypergeometric test. A distance of zero results when the position of compared TFBSs is the same.

