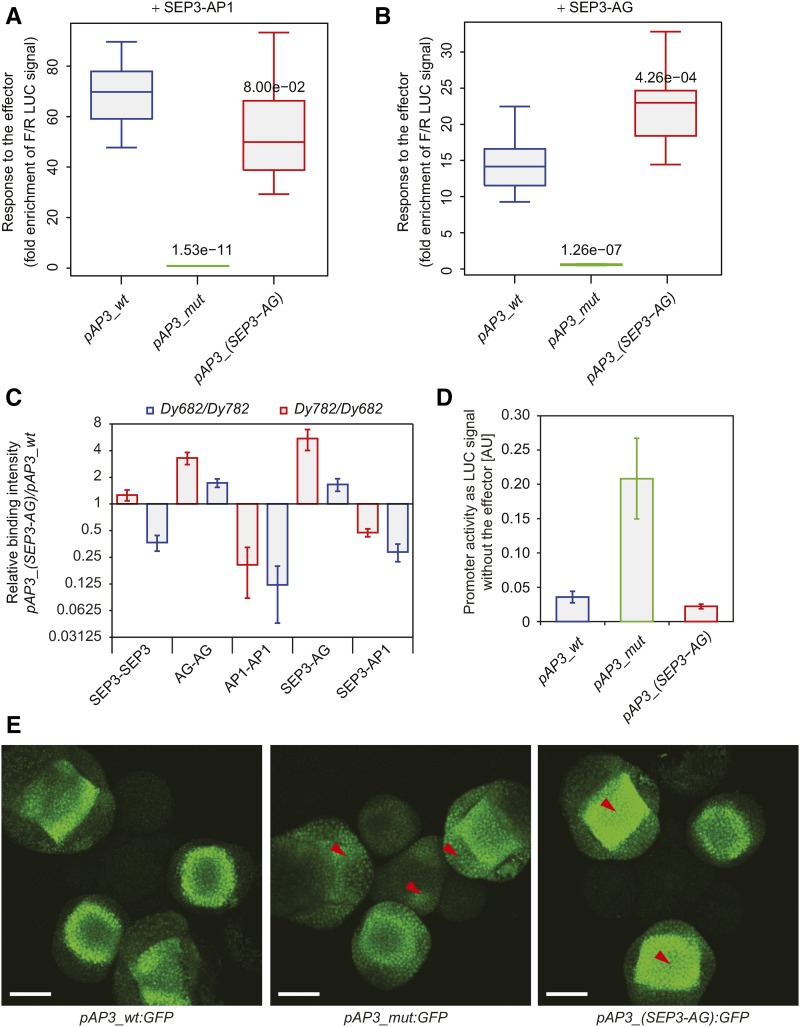
Figure 6.
Comparison of Activities and Protein-DNA Binding between Various MADS Domain Protein Complexes to Modified AP3 Promoters.
(A) and (B) Promoter activity quantification in protoplasts using dual luciferase reporter assay with specific protein effector complexes SEP3-AP1 (A) and SEP3-AG (B). Error bars represent sd. Numbers above the boxes represent t test P value of the difference between wild-type and modified promoters.
(C) Protein-DNA relative binding intensities of various MADS domain protein complexes between modified and wild-type AP3 promoters studied by quMFRA. The quMFRA was performed using two sets of IR-labeled DNA sequences (Dy682 and Dy782) where IR fluorophores were reciprocally exchanged between AP3 promoter sequences. Error bars represent sd. Sequences used in EMSA are indicated in Supplemental Table 4.
(D) Basal promoter activity quantification in protoplasts using dual luciferase reporter assay. Error bars represent sd.
(E) Confocal pictures of the fluorescent reporter expression patterns of the wild-type and modified AP3 promoters. Red arrows indicate the most pronounced changes in spatial GFP expression in modified promoter signal compared with the wild-type signal. Bars = 50 µm.

