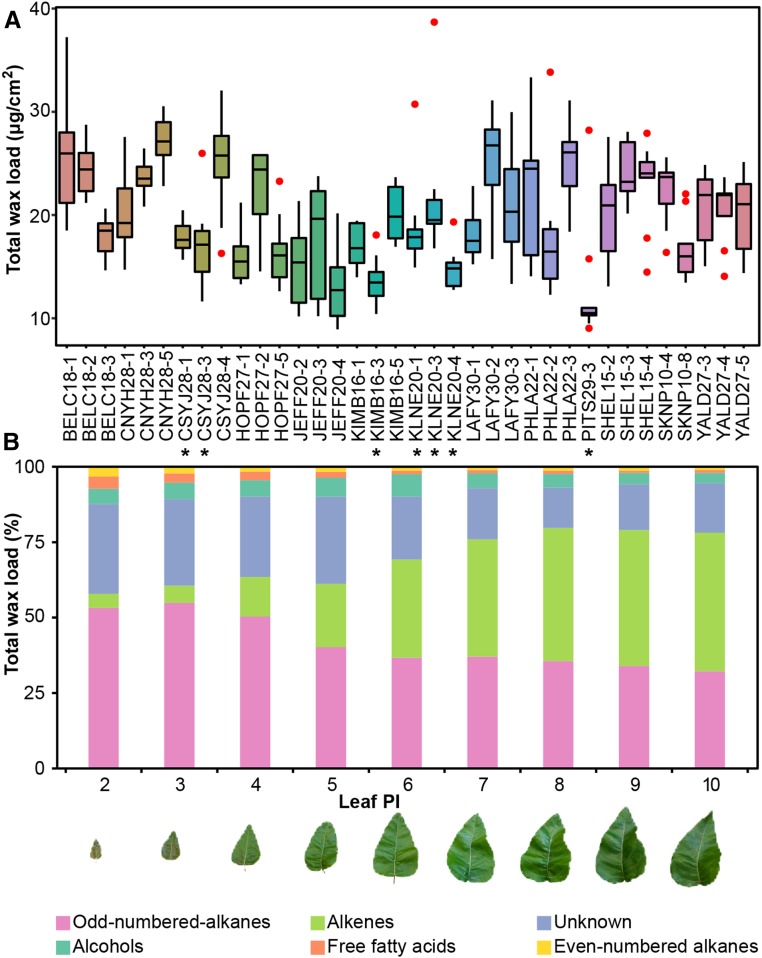
Figure 1.
Variation in Leaf Cuticular Wax in P. trichocarpa.
(A) Large variation in the dispersion of the data across the nine samples (tall box plot for PHLA22-1 and short in PITS29-1). Box plots show the lower and upper quartiles and the median of the total wax load collected from nine leaves sampled from 36 natural accessions. Outliers are shown as red dots. Stars point to accessions that fail to accumulate alkenes (AM).
(B) Changes in relative abundance of chemical classes with leaf ontology. Odd- and even-numbered alkanes, alkenes, alcohols, free fatty acids, and unidentified peaks in leaves derived from BELC18-1 spanning PI-2 through 10. Representative leaves from plastochron index 2 through 10 are shown below.

