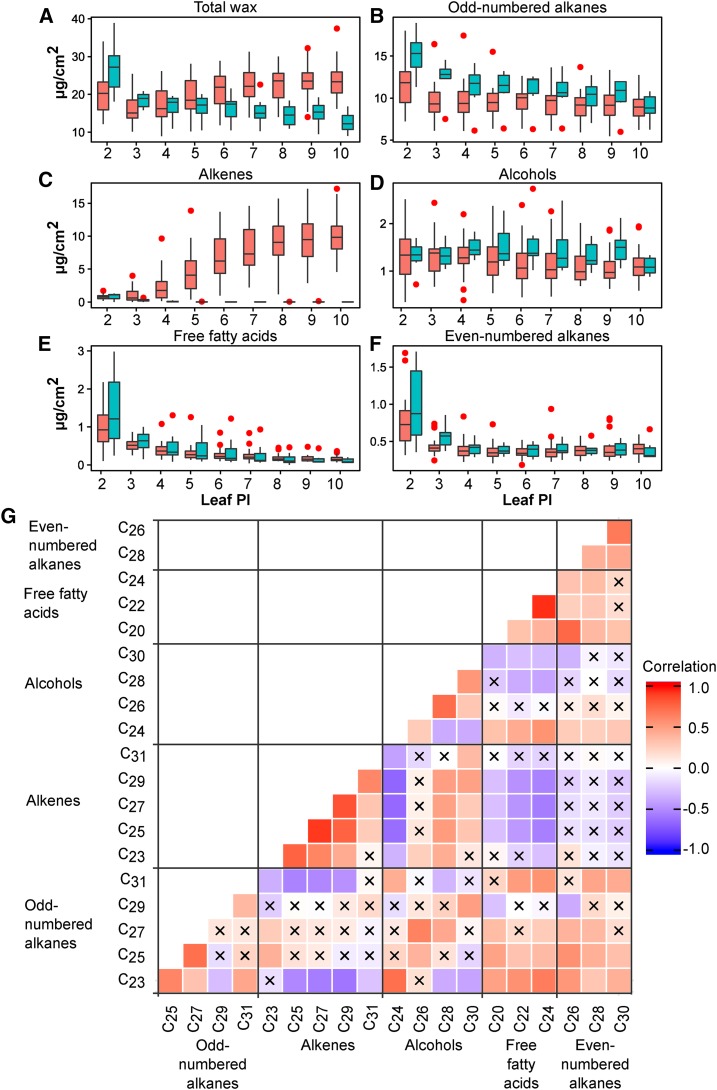
Figure 3.
Changes in Wax Quantity with Leaf Ontology.
(A) to (F) Box plots were used to summarize the data from 29 AP (pink) and 7 AM (blue) accessions. Outliers are shown as red dots. The total wax load (A), odd-numbered alkanes (B), alkenes (C), alcohols (D), free fatty acids (E), and even-numbered alkanes (F) are shown for leaves spanning PI-2 through 10.
(G) Pearson’s correlation heat map for wax classes. Wax components were grouped according to chemical classes. Positive correlations are shown in red and negative correlations in blue (see correlation color key). Coefficients with P values higher than 0.000125 (Bonferroni corrected P value) are marked with an X to represent that they are not significant. Samples from AM accessions were removed from analysis to focus on correlations in the presence of alkenes.

