Figure 6.
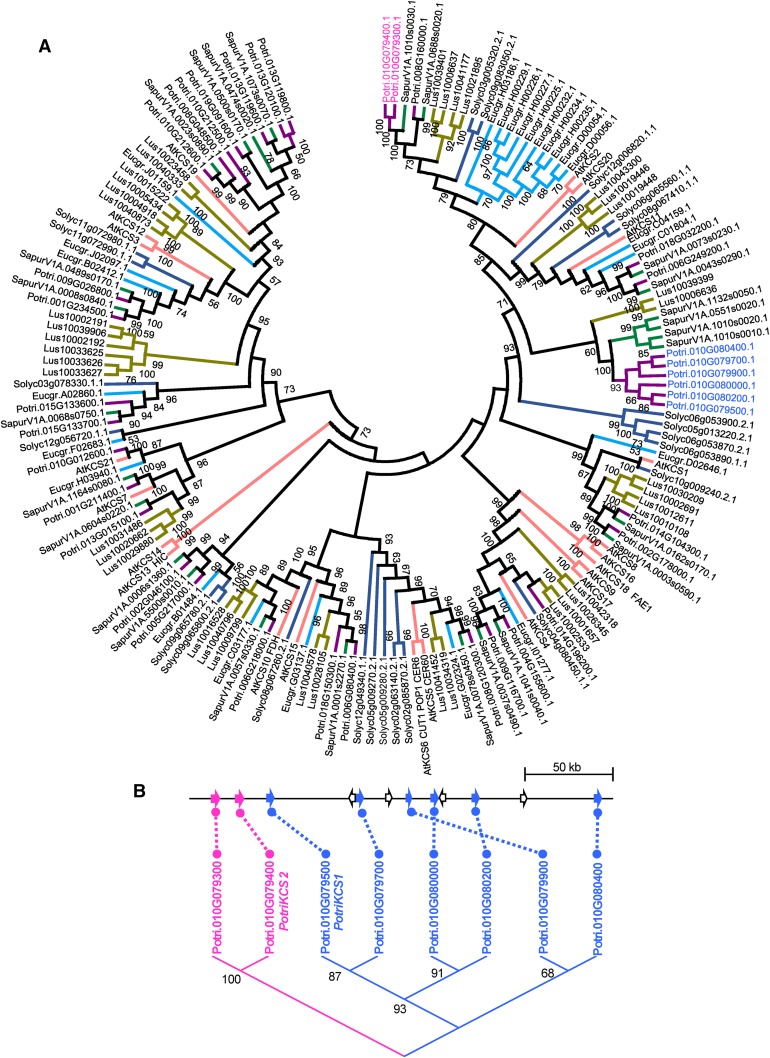
Phylogenetic Analysis of PotriKCS1.
(A) Minimum evolution phylogenetic tree for the KCS gene family. P. trichocarpa (purple), Salix purpurea (green), Linum usitatissimum (brown), Eucalyptus grandis (light blue), Arabidopsis (red), and Solanum lycopersicum (dark blue). Bootstrap values ≥ 50 are shown. Protein alignment was conducted using MUSCLE. The evolutionary distances were computed using the p-distance method. The analysis involved 169 amino acid sequences. Potri.010G012500 was removed from the analysis because there were no overlapping regions between this sequence and Potri.010G012600. Evolutionary analyses were conducted in MEGA6.
(B) KCS gene cluster on chromosome 10. Putative KCS-encoding genes are shown as filled arrows, and non-KCS encoding genes are shown as empty arrows. A maximum likelihood tree is shown below, with bootstrap values depicted above the branches.

