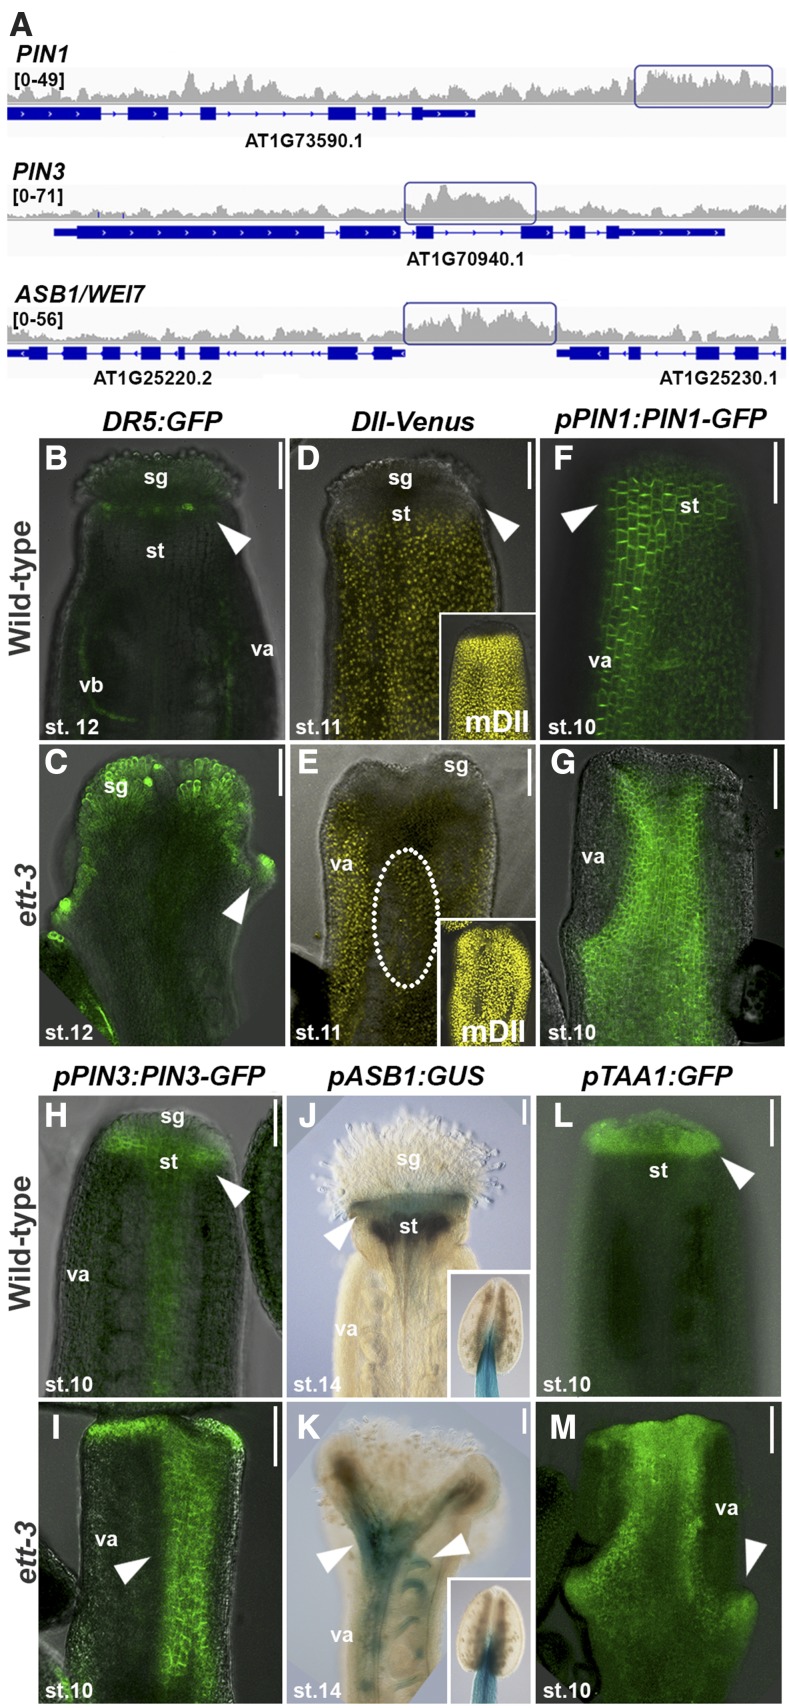
Figure 2.
ETT Regulates Auxin Dynamics in Developing Gynoecium.
(A) Representative raw ChIP-seq peaks (only one replicate shown) for PIN1, PIN3, and ASB1/WEI7 target genes and their expression levels in the ett-3 mutant (on the right). Blue rectangles mark the peak regions. Each gene is represented below with blue bars (exons) and lines (introns).
(B) and (C) Confocal images of DR5:GFP in wild type (B) and ett-3 mutant (C) at stage 12 of gynoecium development.
(D) and (E) Confocal images of DII-VENUS and mDII-VENUS (insets) in the wild type (D) and ett-3 mutant (E) at stage 11 of gynoecium development.
(F) and (G) Confocal analyses of PIN1-GFP fusion protein in wild-type (F) and ett-3 (G) stage-10 gynoecia.
(H) and (I) Confocal analyses of PIN3-GFP fusion protein in wild-type (H) and ett-3 (I) stage-10 gynoecia.
(J) and (K) GUS staining of pASB1:GUS marker line in wild-type (J) and ett-3 (K) stage-14 gynoecia and anthers (inset).
(L) and (M) Confocal analyses of TAA1-GFP fusion protein in wild-type (L) and ett-3 (M) stage-10 gynoecia.
st, style; sg, stigma; va, valves; vb, vascular bundle. Bars = 100 µm.

