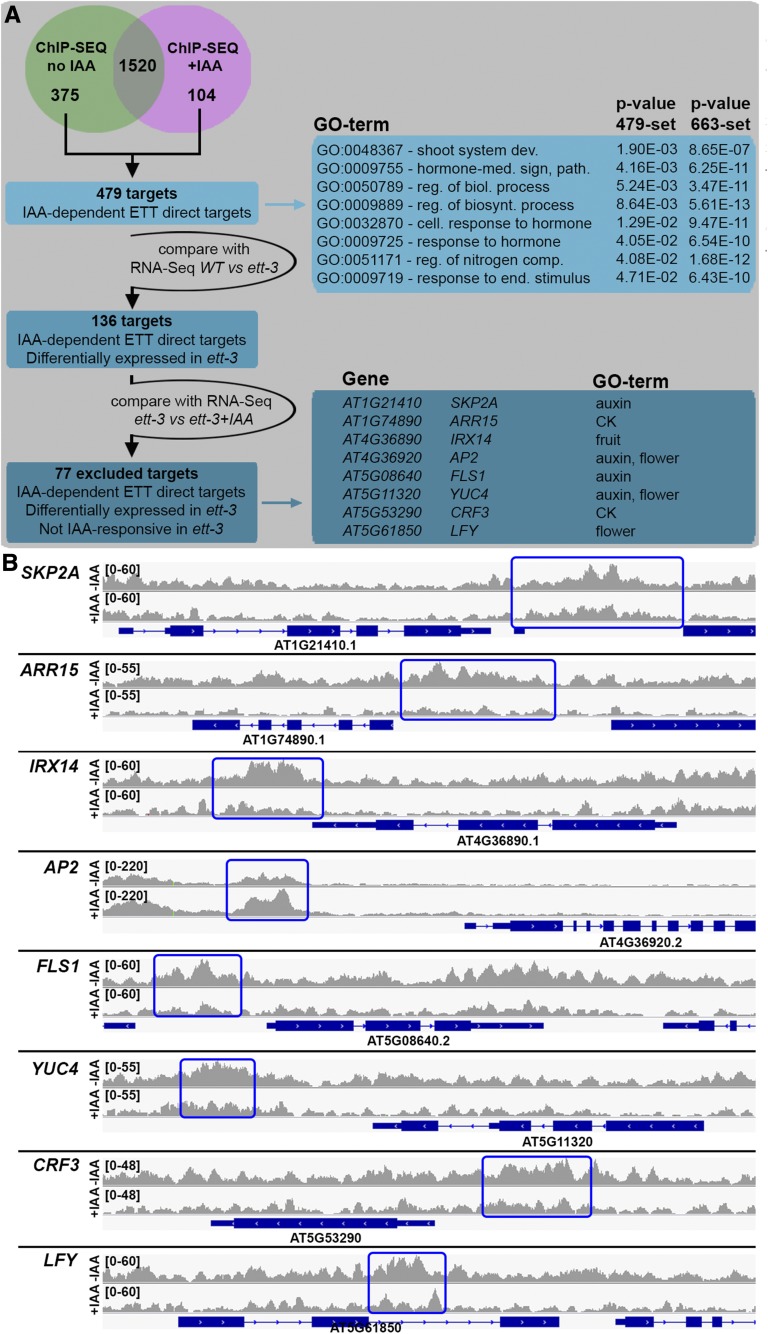
Figure 3.
ETT Regulates a Subset of Target Genes in an Auxin-Dependent Manner.
(A) Venn diagram of ChIP-seq ±IAA. Schematic representation of the strategy adopted to isolate ETT targets for which binding by ETT is IAA dependent and GO terms corresponding to the isolated set of targets.
(B) Representative raw ChIP-seq peaks (one replicate only) for SKP2A, ARR15, IRX14, AP2, FLS1, YUC4, CRF3, and LFY target genes. Blue rectangles mark the peak regions. Each gene is represented below with blue bars (exons) and lines (introns).

