Figure 4.
ETT Is Both a Transcriptional Repressor and Activator.
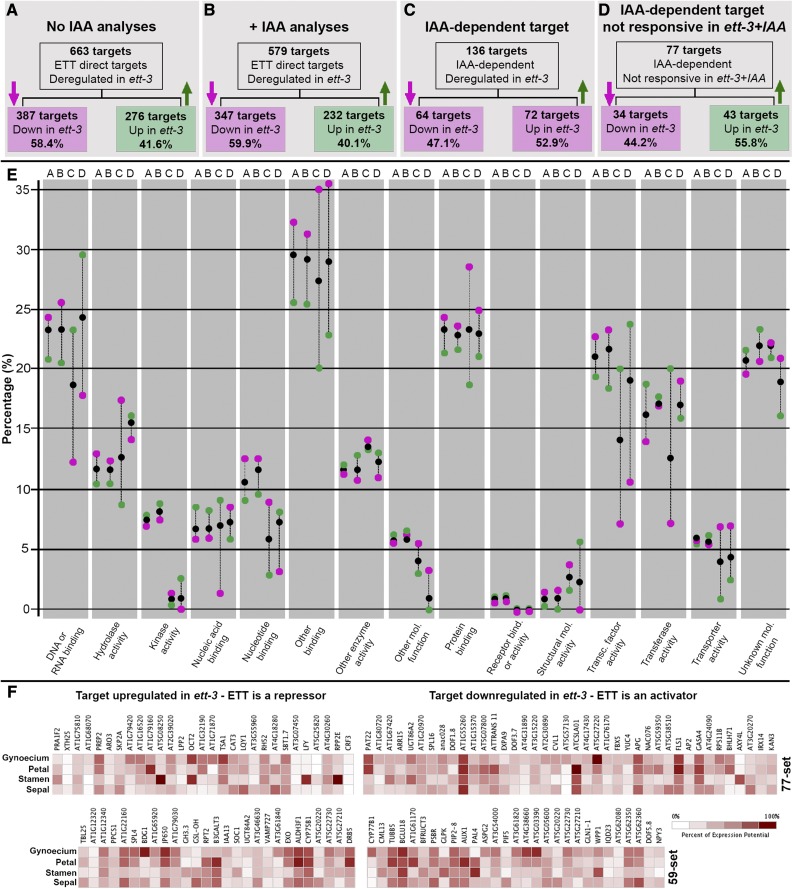
(A) to (D) Schematic representation of subdivision in downregulated (magenta arrow) and upregulated (green arrow) targets for each of the data sets emerging from the comparison of ChIP-seq and RNA-seq: 663 set (A), 579 set (B), 136 set (C), and 77 set (D).
(E) Schematic representation of GO term frequency associated with targets belonging to the upregulated and downregulated subgroups in the ett-3 mutant background. On the x axis are 15 GO term clusters of molecular function. On the y axis is the percentage of genes associated with the corresponding GO term cluster for each data set in (A) to (D). Black dots indicate the whole set, magenta dots indicate the subgroups of downregulated genes, and green dots indicate the subgroup of upregulated genes. A-B-C-D letters on the top of each GO cluster represent the data sets listed in (A) to (D).
(F) Heat map generated with Genevestigator showing expression of the 77-set and 59-set targets (which combined create the 136-set targets). Each set is divided into upregulated (left) and downregulated (right) targets. Color intensity reflects the expression level.

