Figure 8.
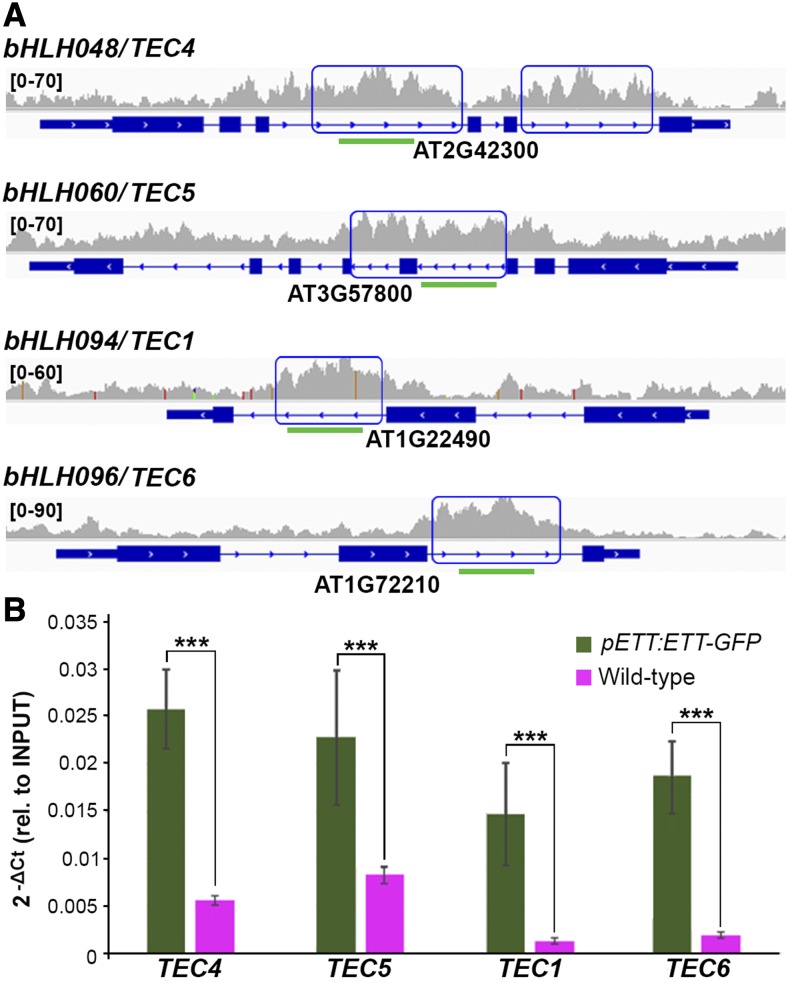
ETT Binds to Intronic Regions of a Set of bHLH Transcription Factors.
(A) Representative raw ChIP-seq peaks (one replicate only) for TEC1 and TEC4 to TEC6. Green lines represent the amplicons tested by real-time PCR.
(B) ChIP analyses with the pETT:ETT-GFP line confirming binding of ETT at the intronic regions of TEC1 and TEC4 to TEC6.
Error bars indicate sd. ***P value < 0.001.

