
Figure 1.
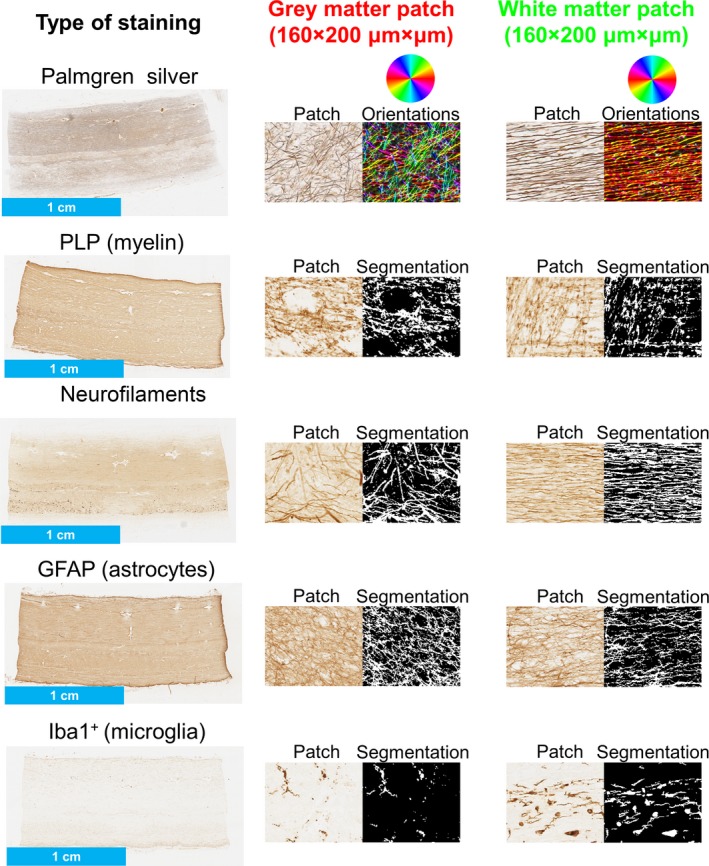
Examples of features in normal control samples from histological images. In the first column, an example of each staining from the upper lumbar control sample is shown. In the central and left columns, examples of raw image patches (160 × 200 μm × μm) from gray and white matter are pictured beside the result of the image processing. Specifically, image processing provided estimates of local neurite orientation (Palmgren silver staining) and segmentations of the stained material for the immunostains (PLP, neurofilaments, GFAP and Iba1+). Neurite orientations were used to evaluated patch‐wise orientation dispersion (metric CV), while the segmented areas to quantify patch‐wise staining fraction (MSF, NSF, ASF, μ GSF).