
Figure 6.
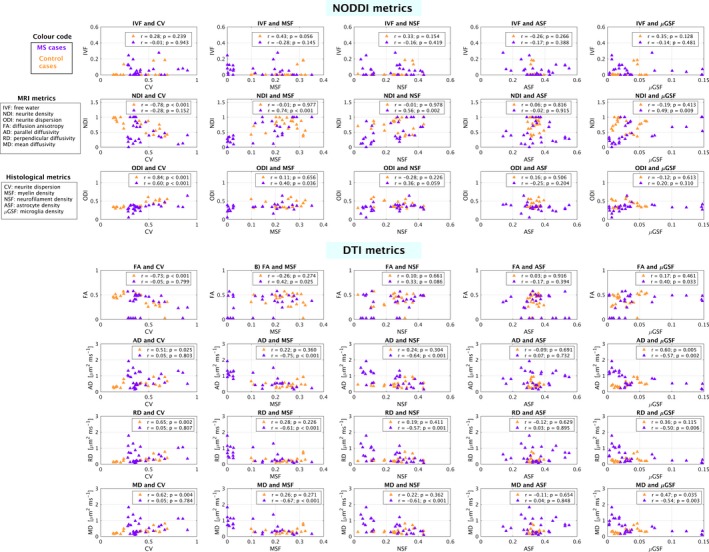
Summary of pair‐wise associations between MRI metrics (NODDI and DTI) and histological indices. Associations are reported as Pearson's correlation coefficients (indicated as r) and were evaluated separately for controls (orange) and multiple sclerosis cases (violet). Data points represent median values within several regions‐of‐interest, outlined on the mean b = 0 MRI images after co‐registration MRI‐histology.