Figure 1.

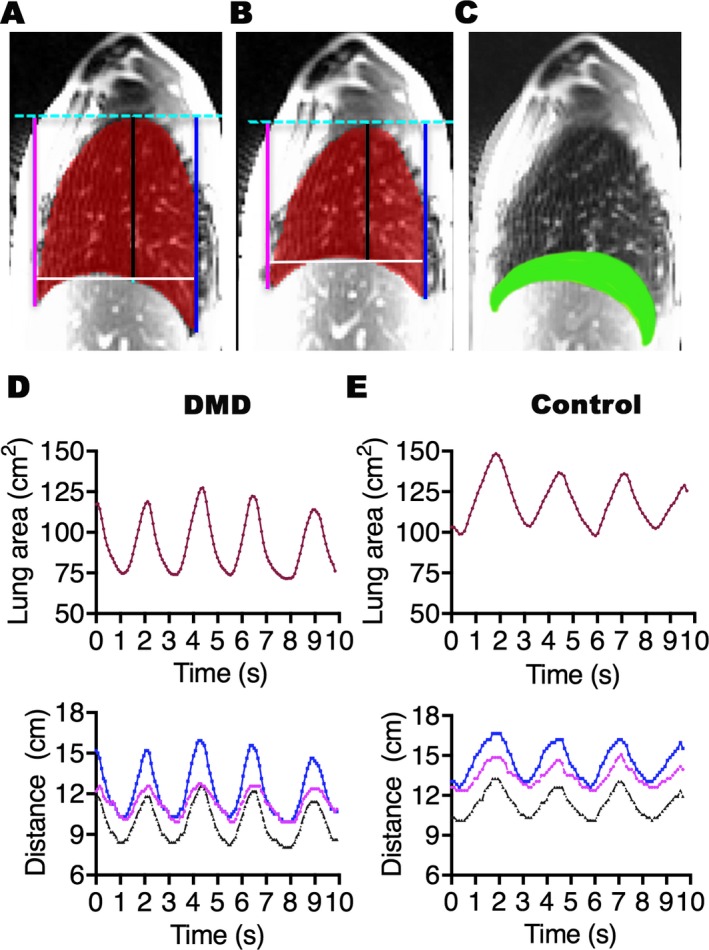
Representative lung segmentations and changes in the lung area and the diaphragm position relative to the thoracic apex over time. Right sagittal images show the lung segmentations (red) and the anterior (magenta), central (black), and posterior (blue) distances between the thoracic apex and the diaphragm at maximal inspiration or total lung capacity (A) and maximal expiration or residual volume (B) of the same subject. The superimposed image (C) of A and B shows the area displaced by the diaphragm motion (green). Note that the HNN method detects the entire length of the diaphragm including the dome and zones of opposition. Graphs show changes in the lung area (red; top panel) and the anterior (magenta), central (black), and posterior (blue) distances (bottom panel) in a 9‐year old individual with DMD (D) and an age‐matched healthy volunteer boy (E) during 10 sec (s) of dynamic MRI recording of maximal breathing. Three complete breathing cycles of maximal inspiration to maximal expiration are shown for each subject. The changes in the lung area follow the same direction as the changes in the distances during a breathing cycle in the patient and the control. All parameters are reduced in the patient compared to the control.
