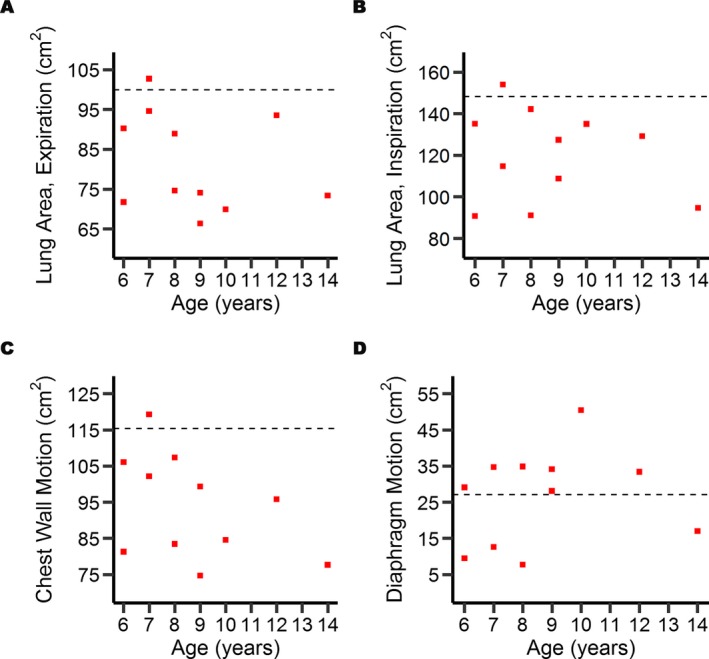
Figure 2.

MRI quantification of the lung area, the diaphragm and chest wall motion in individuals with DMD and healthy volunteer boys. Scatter plots show that the lung area at maximal expiration (A) and at inspiration (B) are reduced in all but one of the patients (red squares) compared to the respective median value in controls (dashed line). The chest wall motion is reduced in all but one patient (C), whereas the diaphragm motion is increased in all but four patients (D) compared to the respective median control value.
