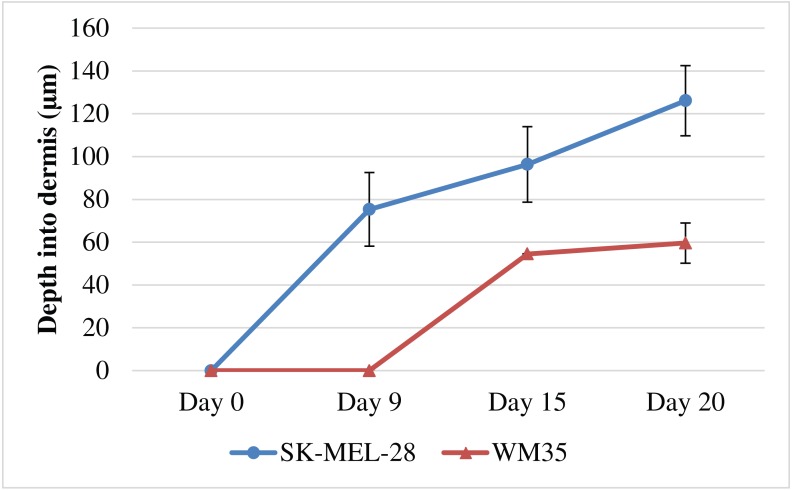
Figure 7. Quantification of melanoma cell invasion depth.
Depth of melanoma invasion for the WM35 (red) and SK-MEL-28 (blue) cell lines. Data points show the average depth of invasion. The error bars measure the variability, as given by the sample standard deviation. In each case the sample mean and sample standard deviation is calculated using measurements from at least nine (n = 9) identically prepared experiments.

