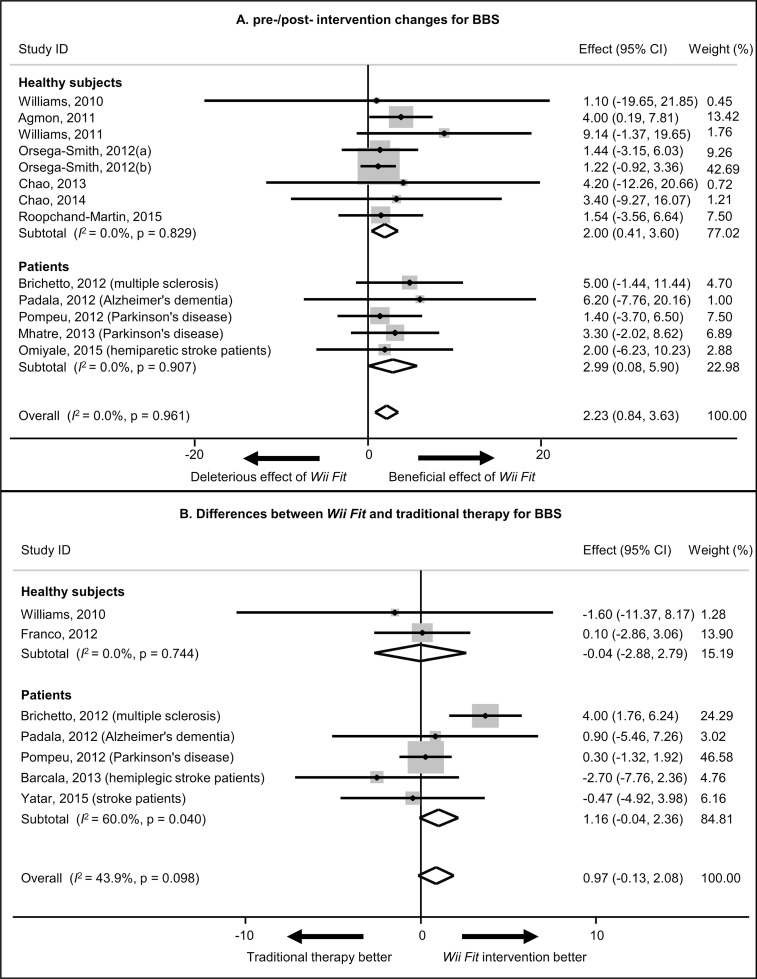
Figure 4. Pre- and post-intervention meta-analytic effect (A) and Wii-Fit vs. traditional therapy meta-analytic effect (B) for the Berg balance score (BBS).
(A) The black point shows the average change for each study. The diamonds describe the pooled values respectively for the change in healthy subjects, patients and the overall population. The vertical black line refers to no change. For each analysis (overall population) or sub-analysis (healthy subjects or patients), a significant effect is observed if the diamond does not touch the black line. (B) The black point shows the difference of effect between Wii Fit and traditional therapy for each study. The diamonds describe the pooled values respectively for the difference of effect in healthy subjects, patients and the overall population. The vertical black line refers to no difference between Wii Fit-induced change and traditional therapy-induced change. For each analysis (overall population) or sub-analysis (healthy subjects or patients), a significant difference is observed if the diamond does not touch the black line. (A and B) The horizontal black line shows the 95% CI and the gray square shows the study weight in percentage. Four-week Wii Fit intervention group (a) and eight-week Wii Fit intervention group (b) (Orsega-Smith et al., 2012). I2: index of heterogeneity.

