Abstract.
A retrospective analysis was conducted of human cases and outbreaks of tularemia in the Republic of Armenia from 1996 to 2012 utilizing geographic information system software. A total of 266 human cases of tularemia were recorded in Armenia from 1996 to 2012, with yearly incidence ranging from 0 to 5.5 cases per 100,000 people. Cases predominantly affected the male population (62.8%), 11–20 year age group (37.2%), agricultural workers (49.6%), and persons residing in rural areas (93.6%). In 2003, a waterborne outbreak involving 158 cases occurred in Kotayk Marz, and in 2007, a foodborne outbreak with 17 cases occurred in Gegharkunik Marz, attributed to exposure of food products to contaminated hay. Geospatial analysis of all cases showed that the majority were associated with the steppe vegetation zone, elevations between 1,400 and 2,300 m, and the climate zone associated with dry, warm summers, and cold winters. Characterization of these environmental factors were used to develop a predictive risk model to improve surveillance and outbreak response for tularemia in Armenia.
INTRODUCTION
Tularemia is a bacterial zoonosis common in wild rodents. It is transmitted to humans through the mucous membranes or a break in the skin by direct contact with infected animal tissues. It can also be transmitted through a bite from an infected tick, horsefly, or mosquito.1 Francisella tularensis, the etiologic agent, is highly virulent to humans and a range of animals and, when aerosolized, it is easily transmitted with a low infective dose. Person-to-person transmission has not been documented. Francisella tularensis is classified as a select agent because of its very high infectivity and relative stability in aerosols.
Symptoms of tularemia depend on the agent’s route of entry.2 The incubation period is 3–5 days after exposure. Acute symptoms may persist for several weeks. The most commonly reported symptoms are fever, headache, joint stiffness, muscle pains, eye irritation (conjunctivitis if the infection began in the eye), ulcers, shortness of breath, sweating, and weight loss. Tularemia is associated with a variety of complications, including osteomyelitis, pericarditis, meningitis, and pneumonia.
Tularemia is expressed in different clinical forms and varies in severity depending on the virulence of the organism, dose, and site of inoculum. The most common form of the disease is ulceroglandular, characterized by lymphadenopathy and an ulcer at the site of the inoculum that may persist for months. Oropharyngeal or gastrointestinal tularemia can result from the ingestion of contaminated food or water. Pneumonic tularemia, the most acute form of the disease, can occur as a complication of other forms or as a result of inhaling the aerosolized agent. Streptomycin and gentamycin are the drugs of choice for treatment of tularemia.3 Although tetracycline and chloramphenicol are commonly used to treat this infection, these antimicrobials have been associated with treatment failures. Tularemia is fatal in about 5% of untreated cases and in less than 1% of treated cases.
Tularemia has a broad geographic distribution in the Northern Hemisphere.4 Endemic foci of F. tularensis have been identified in most countries in Eastern Europe, in the United States, and in Canada. Cases are also reported in Japan and in some regions of China. Geographically, the disease shows a patchy distribution with natural foci. Environmental factors such as climate, host and vector density, and level of susceptibility to infection of different host species can influence the local ecology and can affect the emergence of tularemia in new areas.5
Tularemia is a public health priority for the Republic of Armenia, being endemic across approximately 95% of the country. Since F. tularensis is a select agent,3 marzes (administrative regions) are required to submit monthly reports of human cases to the Center for Disease Control and Prevention (CDCP) in Yerevan. Most cases are diagnosed and confirmed through serology. Under the Soviet regimen, vaccination was conducted routinely among persons residing in areas of natural foci. Currently, vaccination is used when an epizootic focus is identified near human settlements and when a human case or an outbreak is reported.
This study reviewed data from human tularemia cases reported in Armenia from 1996 to 2012. The objectives were to assess demographics, clinical presentation, and risk factors associated with occupation and exposure, and to determine the spatial distribution of cases and associated environmental risk factors using geographic information system (GIS) software.
MATERIALS AND METHODS
Epidemiological data collection from CDCP archives.
Data on human tularemia cases recorded in monthly and annual reports from 1996 to 2012 were collected from CDCP archives in Yerevan. Missing case data were obtained from regional health centers that included clinics, hospitals, polyclinics, and CDCP regional branches. Each case record included demographic data (age, gender, education level, and occupation), epidemiological data (source of exposure and risk factors), and clinical data (clinical symptoms, date of onset, laboratory results, vaccination status, and case classification).
In 2001, standard case definitions for infectious diseases were introduced in Armenia. Based on these definitions, tularemia cases are classified as suspect (having clinical presentation consistent with tularemia), probable (suspect with one positive F. tularensis antibody detection test or with an epidemiological link with a laboratory-confirmed case), or confirmed (suspect or probable case where diagnosis is verified by laboratory testing). To differentiate between infected and vaccinated individuals, antibody titers are determined by agglutination reaction over the course of several weeks. In infected individuals, antibody titers increase, whereas titers remain steady in vaccinated individuals.
Data collection involved review of form cards, disease history, outpatient cards of State Hygiene and Anti-Epidemic Inspectorate regional and marz centers, and those available at polyclinics and infectious disease referral hospitals. A questionnaire was developed and provided to local inspectorates in areas where human cases were recorded. Each case was documented using the questionnaire and, if needed, ex-patients were interviewed, when possible, to clarify specific data. Descriptive analysis was conducted comparing variables collected from the questionnaires using SPSS statistical analysis software (IBM, Armonk, NY).
GIS data processing and map generation.
Human case data were entered into a Microsoft Excel database and georeferenced using ArcGIS 10.1 (ESRI, Redlands, CA). A series of maps were produced using several GIS software products: ArcView GIS, ArcGIS Spatial Analyst, and ArcGIS Geostatistical Analyst (ESRI, Redlands, CA). The software used data from the following source maps obtained from the American University of Armenia and the Electronic Integrated Disease Surveillance System of the Defense Threat Reduction Agency: Administrative, Agriculture, Geology and Geomorphology, Landscape, Rivers and Lakes, Settlements, Water Resource Management, Boundary of Regions, Boundary of Districts, Digital Elevation Model of Armenia, Mountain Peaks, Reservoirs, Vegetation Cover, Roads of Armenia, Streets of Yerevan, and Water Use.
Geospatial analysis.
To test for clustering and to distinguish between areas of high (hot spots) and low (cold spots) concentrations of human cases of tularemia in Armenia, hot spot (Getis-Ord*) and spatial autocorrelation (Global Moran’s I) analyses were conducted using ArcGIS 10.1. The locations of the patients’ residences were overlaid on vegetation maps (nine categories), climate (10 categories), and landscape zones (10 categories), and the proportion of cases in each category was determined.
An overlay analysis was conducted with the locations of the human cases and environmental layers based on the previous results comparing vegetation, climate, landscape elevation zones, and the human tularemia cases to create a suitability model that identified areas where cases are more likely to occur. The categories within each zone were scored for suitability using a 0–10 scale. The categories with the highest proportion of cases were selected and scored a 10, and the model was applied over the territory of the Republic of Armenia to produce a map indicating the zones of highest risk for acquiring tularemia. To confirm the map overlay of the risk zones, a regression analysis was conducted using Ordinary Least Squares (OLS) linear regression method to determine significant variables and create a predictive model using ArcGIS 10.1. The dependent variable was human cases per village, and the independent variables were the environmental layers included in the previous analysis.
RESULTS
Incidence.
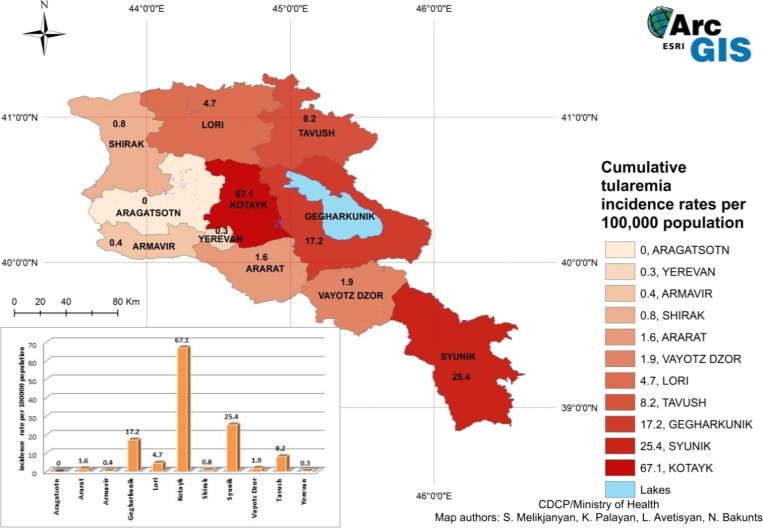
A total of 266 human cases of tularemia were recorded in Armenia from 1996 to 2012. The yearly incidence ranged from 0 to 5.5 cases per 100,000 people. Figure 1 shows the cumulative incidence from 1996 to 2012 of tularemia cases by marz, with Kotayk and Syunik marzes having the highest incidence, 67.1 and 25.4/100,000 population, respectively. Cases of tularemia were registered in all marzes with the exception of Aragatsotn. The number of human tularemia cases recorded yearly in Armenia has been relatively low in general; outbreaks in two marzes resulted in the highest number of cases, one recorded in Kotayk (162) in 2003, the other in Gegharkunik (37) in 2007. During the last 10 years, no fatal cases of tularemia were reported.
Figure 1.
Incidence of human cases of tularemia in Armenia by marz from 1996 to 2012. This figure appears in color at www.ajtmh.org.
Outbreaks.
In 2003, a waterborne outbreak occurred in Kotayk Marz, Fantan community, with 158 reported cases. An investigation of the water supply revealed that the most likely source of exposure was underground water percolating from a field 20,000 m2 in area that was covered with rodent burrows. The lack of hermetic conditions in the basin for water accumulation enabled contamination of the water supply reservoir.
A foodborne outbreak was recorded in Gegharkunik Marz, Tsovagyugh community, in 2007. Seventeen cases were recorded, with an additional case in a neighboring village. The community is adjacent to Lori Marz, which recorded an epizootic outbreak in the rodent population in the autumn of 2006. The investigation indicated that the potential source of exposure was contaminated hay that was brought into the community.
Demographics and risk factors.
Demographic data from the 266 recorded tularemia cases revealed 167 patients were male (62.8%) with a mean age of 23, while 99 patients were female (37.2%), with a mean age of 26. Overall mean patient age was 25. The distribution of tularemia cases by age group is shown in Table 1. There was a significant difference among the age groups (P < 0.05), with the highest number of cases (99) occurring in the 11–20 age group (37.2%). Of the patients that reported an occupation (91.35%), the majority identified as agricultural workers (132/266 or 49.6%). School-age children represented 83 cases (31.2%). Reported rural cases outnumbered reported urban cases, 243 (91.3%) to 23 (8.7%).
Table 1.
Comparison of outbreak-associated and nonoutbreak-associated cases of tularemia in Armenia from 1996 to 2012
| Demographics and risk factors | Nonoutbreak-associated cases (N = 71) | Outbreak-associated cases (N = 195) | Total number of cases (N = 266S) |
|---|---|---|---|
| Sex | |||
| Female | 33.3% | 39.2% | 37.2% |
| Male | 66.7% | 60.8% | 62.8% |
| Age | |||
| 0–10 | 16.7% | 12.5% | 13.9% |
| 11–20 | 41.1% | 35.2% | 37.2% |
| 21–30 | 22.2% | 21.0% | 21.4% |
| 31–40 | 6.7% | 9.7% | 8.6% |
| 41–50 | 7.8% | 13.6% | 11.7% |
| 51–60 | 4.4% | 4.5% | 4.5% |
| 61–70 | 1.1% | 3.4% | 2.6% |
| Occupation | |||
| Agricultural worker | 37.8% | 55.7% | 49.6% |
| Shepherd | 6.7% | 1.1% | 3.0% |
| Teacher | 2.2% | 0.6% | 1.1% |
| School children | 28.9% | 32.4% | 31.2% |
| Pre-school children | 11.1% | 9.7% | 10.2% |
| Other | 13.3% | 0.6% | 4.9% |
| Location of residence | |||
| Urban | 18.9% | 0.0% | 6.4% |
| Rural | 81.1% | 100% | 93.6% |
| Source of exposure | |||
| Agricultural activities | 12.2% | 0.0% | 4.1% |
| Hunting activities | 1.1% | 0.0% | 0.4% |
| Working in recently populated areas | 1.1% | 0.0% | 0.4% |
| Reservoir water | 6.7% | 93.2% | 63.9% |
| Foodborne | 34.4% | 4.0% | 14.3% |
| Vector borne | 20.0% | 0.0% | 6.8% |
| Contact with rodents | 6.7% | 1.1% | 3.0% |
| Other | 17.8% | 1.7% | 7.1% |
Table 1 compares the demographic data between outbreak-associated and nonoutbreak-associated cases. The data reveal no significant differences among sex and age groups, but do indicate a significant difference within occupation. Agricultural workers comprised 37.8% of nonoutbreak-associated cases and 55.8% of outbreak-associated cases (P = 0.006); shepherds comprised 6.7% of nonoutbreak-associated cases and only 1.1% of outbreak-associated cases (P = 0.012). Nonoutbreak-associated cases were primarily associated with foodborne (34.4%) and vector borne (20.0%) exposures. Outbreak-associated cases were largely associated with waterborne exposure (93.2%).
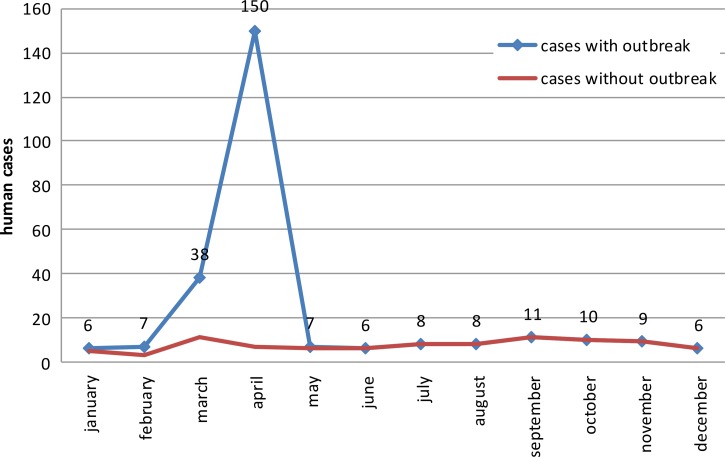
The tularemia cases were analyzed by month of disease onset (Figure 2). When the outbreak-associated cases were excluded, little seasonal variation was observed among the number of human cases per month, except for a minor decrease during the winter months. Both outbreaks occurred in early spring.
Figure 2.
Distribution of human cases of tularemia by month in Armenia from 1996 to 2012. This figure appears in color at www.ajtmh.org.
Clinical aspects.
Data on clinical symptoms were collected for the tularemia cases. The most common symptoms reported among the 266 cases were weakness (87.6%), headache (78.9%), muscle pain (77.4%), fatigue (75.2%), and lymphadenopathy (69.9%). Fever did not appear to be a predominant feature of this disease. Although females more frequently reported the presence of headache, muscle pain, weakness, and fatigue, the differences between females and males was not statistically significant (P > 0.05).
Of the 266 tularemia patients, 85 (32%) were hospitalized; of these, 56 (21%) were male and 29 (11%) were female. Patients in the 11- to 20-year-old age group had the highest percentage of hospitalization with 36 patients (13.6%). No mortalities from tularemia have been reported since 1996.
Since 2001, 262 cases have been reported, with 75 classified as probable and 187 as laboratory confirmed. When classified according to presentation, cases were distributed as follows: glandular, 69% (182 cases); anginal-bubonic, 3% (8 cases); and oculoglandular, 28% (75 cases). Of these 262 patients, only two were vaccinated (0.7%), both in 2003. Onset of disease occurred in 2004 for the first patient and in 2009 for the second patient. Both patients were schoolchildren, one male, and one female. Neither were hospitalized.
Spatial analysis.
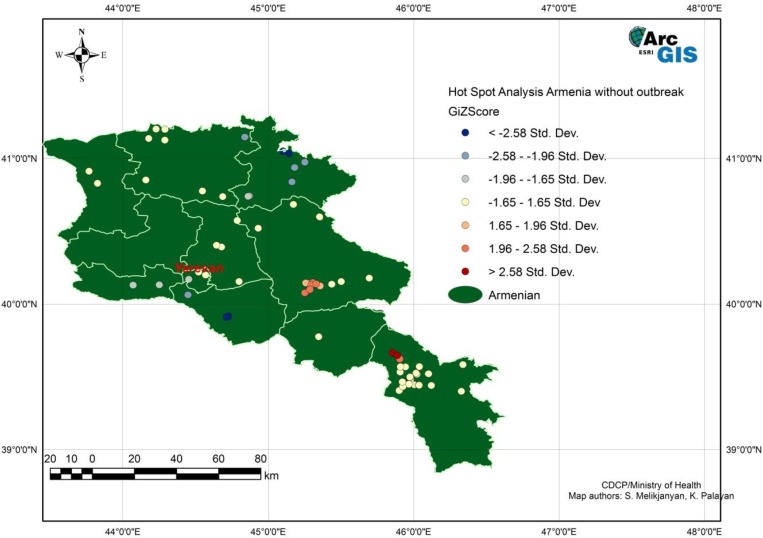
Human tularemia cases from 1996 to 2012, excluding cases from the two outbreaks, were examined for clustering using average nearest-neighbor analysis. Significant clustering was detected (z = −9.475644, P < 0.00). The same analysis conducted with the locations of villages indicated that clustering of cases occurred to a higher degree than village locations. Results of the Getis-Ord* analysis showed hot spots (areas of increased density of cases) near the center and southeast of Armenia, and cold spots (areas of decreased density of cases) near the northeast and southwest borders (Figure 3).
Figure 3.
Hotspot analysis of human tularemia cases excluding outbreak cases from 1996 to 2012 in Armenia using Getis-Ord-Gi* method. This figure appears in color at www.ajtmh.org.
The locations of reported cases, including those associated with outbreaks, were overlaid with environmental layers, including landscape elevation, vegetation, and climate zones. The elevation in Armenia ranges from 400 to 4,090 m. The majority of cases were located at the middle mountain steppe elevation, which ranges from 1,400 to 2,300 m. The remaining cases were mostly present within 2,200–2,800 m of elevation, encompassing meadow mountain steppes and mountain subalpine landscape regions. Within the vegetation zone layer, the majority of cases (199), including the outbreak cases, were located in the steppe vegetation zone. Other zones where cases most frequently occurred were forest (33) and meadow steppe (18) vegetation zones. These three zones contained 95.4% of the cases. Within Armenia’s 10 climate zones, the majority of cases (224), including the outbreak cases, were located in the moderate, relatively dry, warm summers and cold winters zone. The zone with the next highest number of cases (18) was the moderate, relatively humid during all seasons zone. These two zones contained 92.3% of the cases.
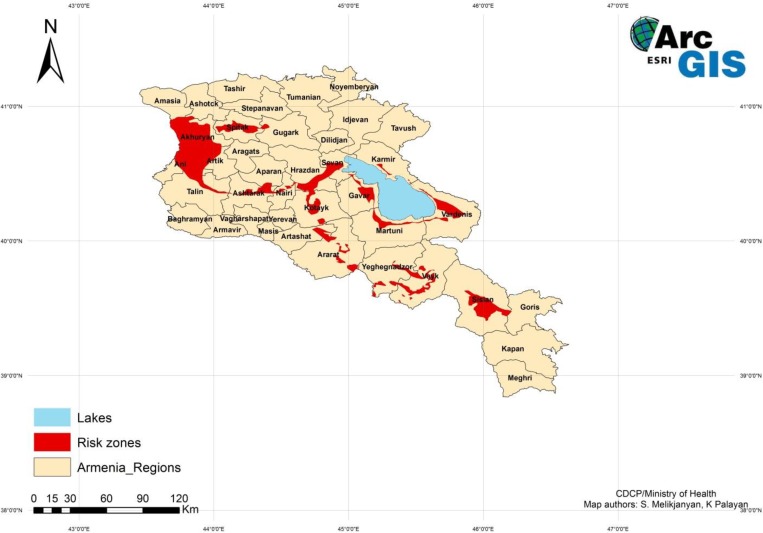
A suitability map delineating areas of increased risk of acquiring tularemia was created (Figure 4) using the overlay analysis method and ranking the zones on a scale of 1–10, where 10 indicated zones with the most cases. The areas designated as 10 were steppe vegetation zone, moderate and relatively dry warm summer/cold winter climate zone, and middle mountain steppe landscape zone, which corresponded to the 1,400–2,300 m elevation zone. The map shows limited areas of suitability with the largest area in the western part of the country, a smaller area in the southeast, and a few scattered areas surrounding Lake Sevan, the large lake in the center of the country. The risk zones created with the overlay analysis were confirmed with OLS regression analysis. The OLS regression analysis produced a map indicating locations with a standard deviation greater than 2.5 that coincided with the same risk zones as the suitability map. The cases, including the outbreaks, fell within the previously determined risk zones.
Figure 4.
Suitability map for areas in Armenia with increased risk of human tularemia. This figure appears in color at www.ajtmh.org.
DISCUSSION
A review of the data collected in Armenia shows that the incidence of tularemia is low and occurrence of cases tends to be sporadic. However, the occurrence of two outbreaks indicates that environmental factors are present that can lead to increased numbers of cases in localized areas. The outbreak in Fantan community occurred due to an interruption in the water supply that led residents to use a water source contaminated by rodents infected with F. tularensis. The outbreak in Tsovagyugh community is believed to have been caused by the transport of infected hay grown and harvested in an area endemic for tularemia. Both outbreaks had a common point source exposure that resulted in multiple persons being infected at one point in time.
Descriptive analysis of the 266 human cases showed that males were infected approximately twice as frequently as females. The 11- to 20-year-old age group had the greatest number of cases; approximately 60% of the cases were under the age of 30. Among occupational groups, agricultural workers and school age children were most commonly infected. Infected individuals resided predominantly in rural areas. The combination of these demographic factors indicates that the groups at highest risk are young male students or agricultural workers living in rural areas of the country.
Clinical presentation of tularemia in Armenia typically includes weakness, headache, muscle pain, fatigue, and lymphadenopathy. These symptoms correspond to systemic illness, although fever was rarely reported. Glandular and oculoglandular tularemia were the most common forms observed, comprising 97% of cases. The location of the lymphadenopathy was not recorded for each patient, but the forms are consistent with the main routes of exposure reported––foodborne and vector borne.
An analysis of the monthly temporal pattern of reported cases indicated that seasonality may play a minor role in tularemia patterns. Although a peak in cases may be expected in the spring and fall, it may not be identified due to delayed diagnosis. The spring peak would most likely be due to arthropod transmission, while a fall peak may be due to arthropod and waterborne transmission.
The GIS overlay analysis delineated the risk zones where there is a high probability of occurrence of tularemia. Identifying high risk areas allows public health officials to focus surveillance efforts in areas of greatest risk, thus facilitating early detection of new cases and prompt public health interventions, such as vaccination, vector and reservoir control, and other preventive measures. It also informs public health decision-making with regard to the targeting of resources for prevention, public education in high risk areas, and physician awareness of tularemia as a potential diagnosis. An early and accurate diagnosis leads to prompt treatment, increased probability of early recovery, and decreased need for hospitalization.
CONCLUSIONS
The retrospective analysis of tularemia cases in Armenia has identified groups at highest risk for exposure to tularemia. Temporal analysis has shown that tularemia does not appear to be seasonal. Geospatial analysis of specific elevations, climate, and vegetation zones within the country has identified environmental characteristics where there is increased risk of exposure to F. tularensis vectors and/or reservoirs. This study established the first use of a GIS in Armenia to produce a predictive risk model for tularemia. This methodology can be applied to predict high risk zones for other vector borne diseases endemic in Armenia, and also expanded to include neighboring countries in a regional approach to improve surveillance and outbreak response.
Disclaimer: The authors declare that they have no competing interests. All opinions expressed in this article are those of the authors and do not necessarily reflect the policies and views of DTRA and of the U.S. Centers for Disease Control and Prevention.
REFERENCES
- 1.Ellis J, Oyston PCF, Green M, Titball RW, 2002. Tularemia. Clin Microbiol Rev 15: 631–646. [DOI] [PMC free article] [PubMed] [Google Scholar]
- 2.Oyston PCF, Sjostedt A, Titball RW, 2004. Tularemia: bioterrorism defence renews interest in Francisella tularensis . Nat Rev Microbiol 2: 967–978. [DOI] [PubMed] [Google Scholar]
- 3.Dennis DT, et al. , 2001. Tularemia as a biological weapon: medical and public health management. JAMA 285: 2763–2773. [DOI] [PubMed] [Google Scholar]
- 4.Petersen JM, Mead PS, Schriefer ME, 2009. Francisella tularensis: an arthropod-borne pathogen. Vet Res 40: 7. [DOI] [PMC free article] [PubMed] [Google Scholar]
- 5.Eliasson H, Broman T, Forsman M, Bäck E, 2006. Tularemia: current epidemiology and disease management. Infect Dis Clin North Am 20: 289–311. [DOI] [PubMed] [Google Scholar]


