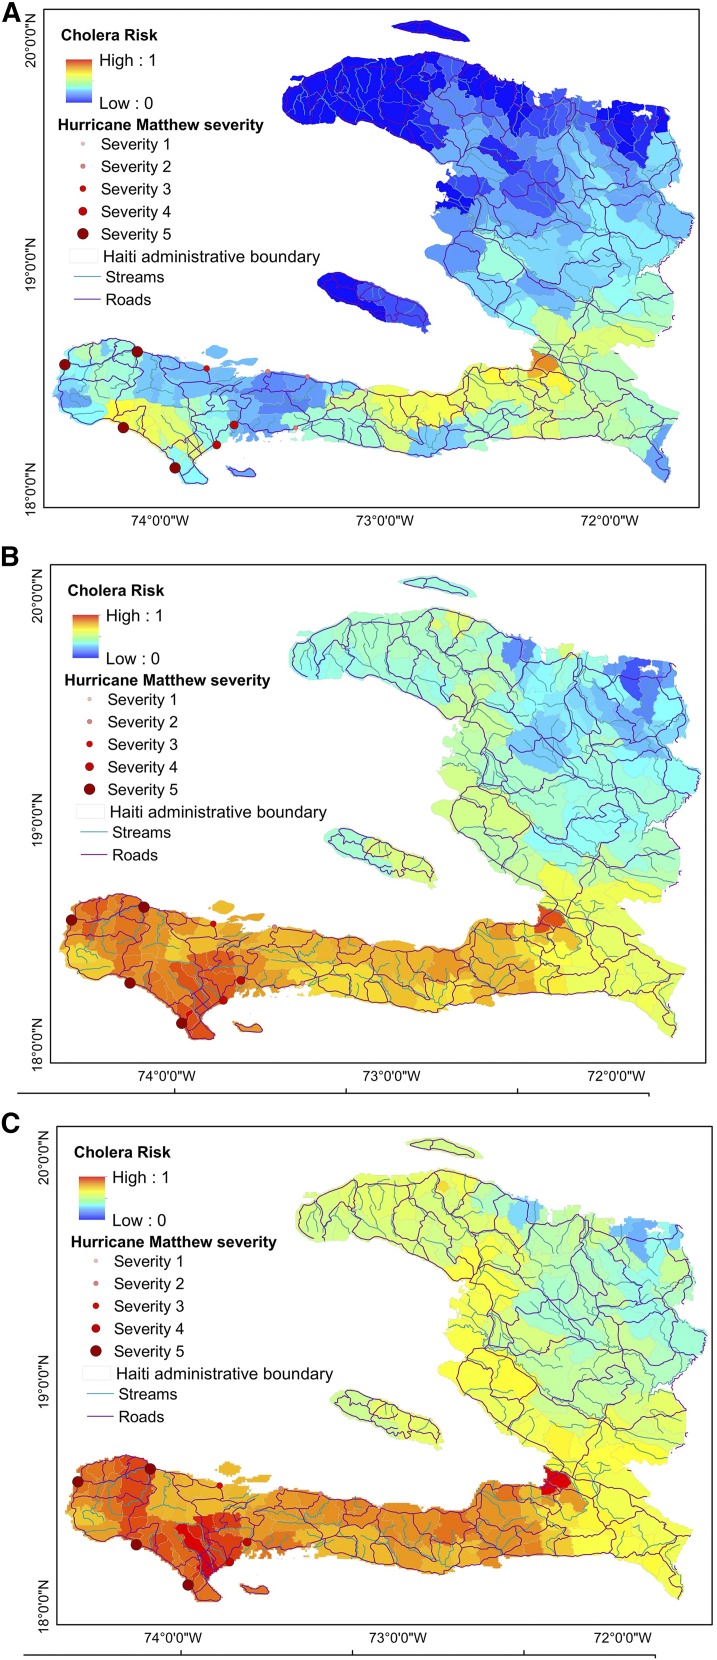
Figure 5.
(A) Cholera risk map based on pre-hurricane hydroclimatic conditions for the month of September 2016, (B) cholera risk map for the post-hurricane period October 7–November 06, 2016, and (C) cholera risk map for post-hurricane period October 14–November 13, 2016. This figure appears in color at www.ajtmh.org.

