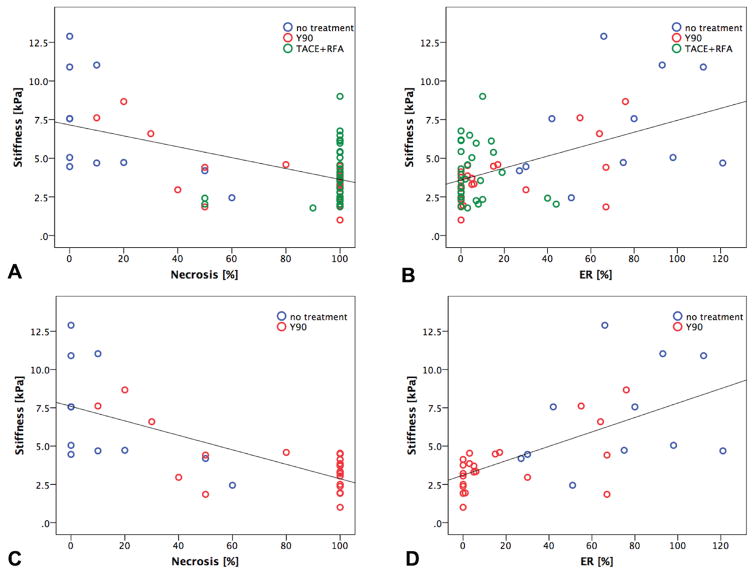
Figure 2.
Scatterplots show Pearson correlation between HCC tumor stiffness values measured with MRE and visually assessed degree of tumor necrosis (r= -0.540, P= 0.0001) (A) and enhancement ratios (r= 0.514, P= 0.0001) (B), respectively. The observed correlations were stronger in the group of patients treated with RE (r= -0.771, P= 0.0001) (C) and (r= 0.636, P= 0.0001) (D), respectively.

