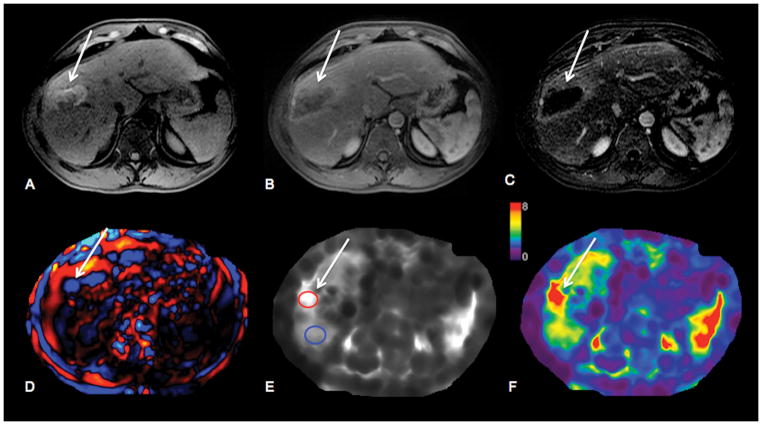
Figure 5.
56-year-old male patient with HCV cirrhosis and HCC in right hepatic lobe treated with transarterial chemoembolization plus radiofrequency ablation. HCC (arrows) shows hyperintense signal on native T1-weighted images (T1WI) (A) compatible with hemorrhagic changes post treatment, and no enhancement on contrast-enhanced T1WI during arterial phase (B). Subtraction image (C) shows complete tumor necrosis. Wave image (D) demonstrates excellent wave propagation through the tumor, with longer wavelength in tumor compared to surrounding liver parenchyma. Stiffness map (E) demonstrates visually higher stiffness in HCC vs. liver parenchyma (stiffness values were 7.3 kPa in HCC and 4.7 kPa in liver). Treated HCC is visualized on elastogram color map (F).

