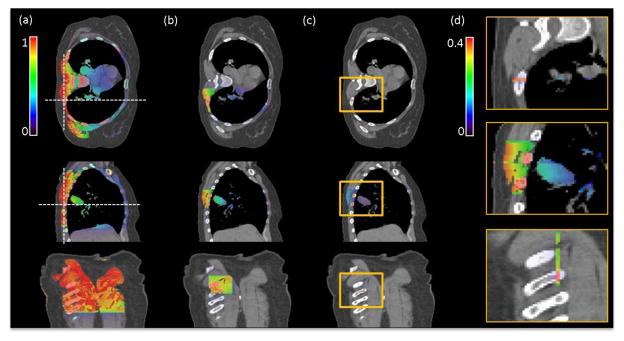
Figure 8.
Results of the MC imaging dose calculation for a lung cancer patient. a) CBCT projection with a large field of 26.7 × 20.0cm2 at isocenter. b) Projection with a reduced field of 6.78 × 6.78 cm2. c) The slit beam with 0.2 × 6.78 cm2 corresponding to the setup shown in Figure 7a) right. d) Zoom-in regions inside the yellow boxes in c) displayed with a narrowed window of [0, 0.4]. The three rows represent transverse, sagittal and coronal views, respectively. Dash lines in a) indicate the location of other views.

