Figure 4.

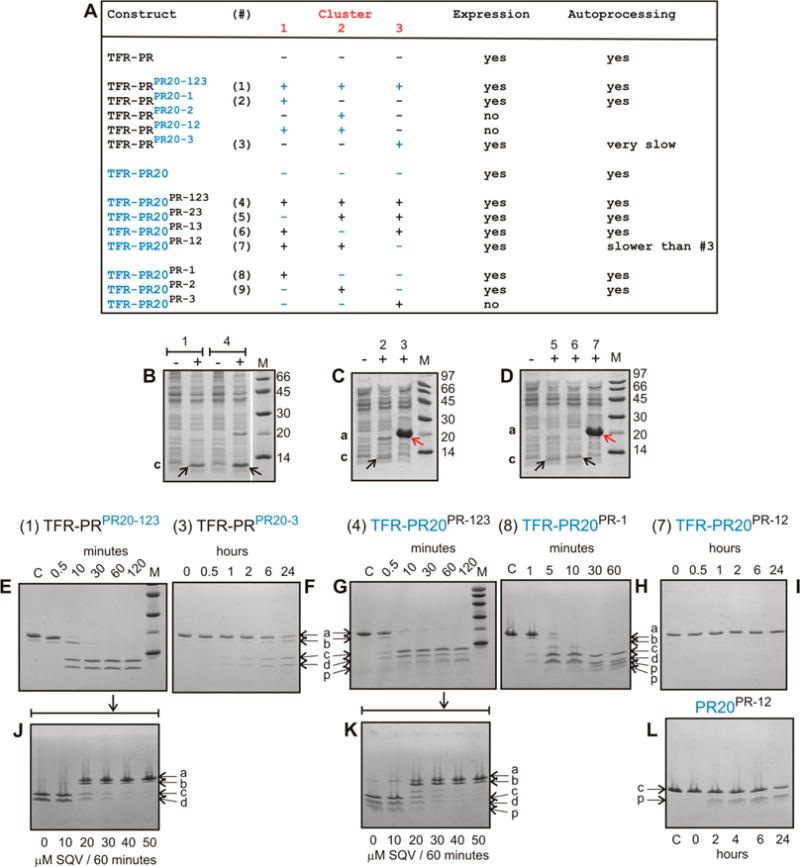
Expression and autoprocessing of TFR-PR precursors. (A) Identification of precursor constructs shown in panels B–I. Individual clusters and various combinations are shown with PR clusters in black and PR20 clusters in blue. (B–D) Expression and autoprocessing of precursor constructs containing one or more substituted clusters. Total cell extracts were analyzed by SDS–PAGE. Numbers above the lanes correspond to the designated construct shown in panel A, and lanes indicated by minus (−) and plus (+) represent total extracts of uninduced and induced cultures, respectively. (E–I) Time course of N-terminal autoprocessing of purified precursors in vitro. (F and I) TFR-PRPR20-3 and TFR-PR20PR-12 exhibit very slow or no discernible autoprocessing, respectively, as indicated in panel A. (J and K) Inhibition of autoprocessing of TFR-PRPR20-123 and TFR-PR20PR-123 conducted for 60 min in the presence of increasing concentrations of saquinavir. (L) Time course of autoproteolysis of mature PR20PR-12. Lowercase letters a–d and p indicate full-length precursor, an intermediate cleavage product of TFR-PR, TFR9–56-PR (cleavage occurs between residues 8 and 9 of TFR), mature PR, TFR and products of mature PR autoproteolysis, respectively. The pathway to release the minor intermediate product TFR9–56-PR precedes the cleavage at the N-terminus of PR. We have shown previously that this cleavage is pH-dependent and becomes pronounced at pH 4.2 M denotes molecular weight markers in kilodaltons. SQV denotes saquinavir.
