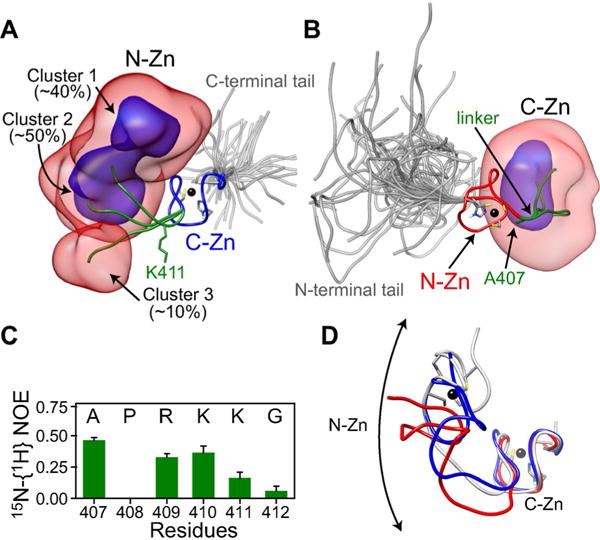
Figure 4.

Three-member ensemble of full-length unliganded nucleocapsid derived from RDC and SAXS-driven simulated annealing. Overall distribution of: A) the N-Zn knuckle when best-fitting to the C-Zn knuckle and B) the C-Zn knuckle when best-fitting to the N-Zn knuckle, displayed as reweighted atomic probability maps[16] plotted at 10% (semi-transparent red) and 50% (blue) of maximum, and calculated from the seven lowest energy Ne=3 ensembles. Representative structures from the three clusters are shown as ribbon diagrams with the N-Zn in red, the C-Zn in blue, the linker in green, and the tails in gray (for each ensemble member within the Ne=3 ensemble, the tails are represented by a five-member sub-ensemble). Zinc atoms are depicted by black spheres. A few residues including those that coordinate the zinc atoms are also shown. C) 15N-{1H} heteronuclear NOE data for linker residues in the context of full-length nucleocapsid (data were recorded in the absence of nucleic acids at 35 °C and a 1H frequency of 500 MHz.) D) Comparison of the cluster 1 conformation (gray) with the ligand-bound conformations observed in structures of nucleocapsid-DNA (blue, PDB 2EXF)[6c] and RNA (red, PDB 1F6U)[6b] complexes. For the sake of clarity, the nucleic acids are not shown.
