Figure 2.

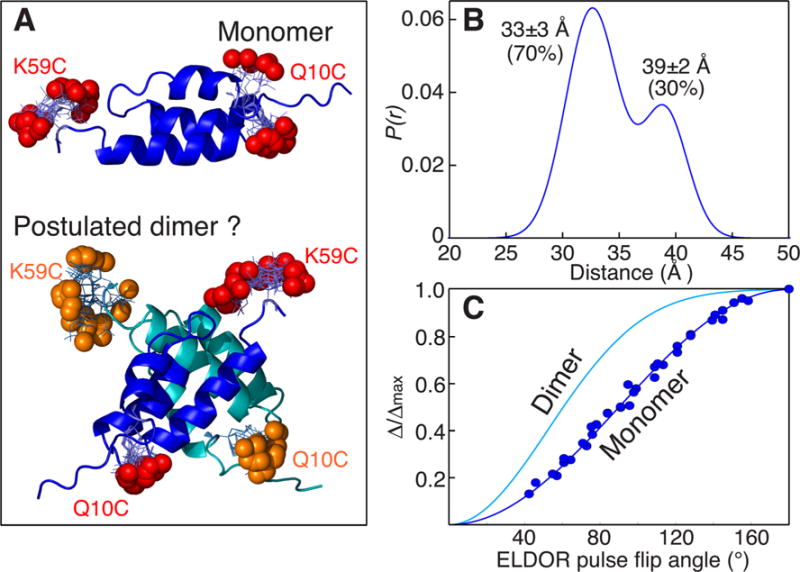
Is Protein A monomeric or dimeric under conditions of the DEER experiment? A) Ribbon diagram of protein A (PDB 1BDD)[12] showing the positions of the nitroxide labels in the monomer (red spheres) and postulated dimer (red and orange spheres). In the dimer the backbone and nitroxide labels of one subunit are shown in dark blue and red, respectively, and in the other subunit in cyan and orange, respectively. The positions of the nitroxide labels were calculated by first optimizing side chain positions using the program SCWRL4.0,[13] and then adding MTSL and calculating their distributions using the program MMMv2013.2.[14] B) Experimentally derived distance distribution from DEER. The DEER data were analyzed using the program GLADD[15] with two Gaussians; similar results are obtained by Tikhonov regularization using the program DEERAnalysis 2013.[16] C) Comparison of the experimental curve of Δ/Δmax versus ELDOR pulse flip angle (blue circles) with the corresponding theoretical curves [cf. Eq. (1)] for a monomer (dark blue line) and a dimer (cyan line). Experimental DEER data were acquired at Q-band on a sample of deuterated (≈97%), 100% MTSL-labeled protein A in 30%(v/v) d8-glycerol and D2O at 50 K (see Supporting Information for full experimental details, including examples of raw and baseline-corrected DEER curves shown in Figure S4; extent of MTSL-labeling and deuteration was determined by liquid chromatography-positive ion electron spray mass spectrometry).
