
Figure 4.
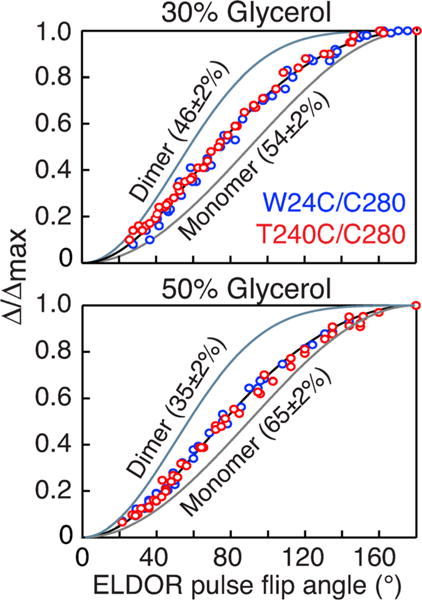
Populations of monomer and dimer for deuterated HIV-1 reverse transcriptase determined by inversion modulated DEER. DEER data were recorded in 30% (top) and 50% (bottom) d8-glycerol. The experimental data for the W24C/C280 and T240C/C280 doubly MTSL-labeled samples are shown as blue and red circles, respectively. The samples were 100%-MTSL labeled and ≈ 97% deuterated as determined by liquid chromatography-positive ion electron spray mass spectrometry (see Supporting Information). The best-fit curves obtained by simultaneously fitting the data for the W24C/C280 and T240C/C280 p66 samples using Equations (1) and (2) is shown as a black line, and the pure monomer and dimer theoretical curves are shown as grey and light blue lines, respectively. The experimental data were acquired at Q-band on a 50 μM sample (in subunits) of deuterated (≈ 97%) p66 in either 30 or 50% (v/v) d8-glycerol and D2O at 50 K. The buffer contained 25 mM Tris-HCl, pH 8, and 400 mM NaCl. For the W24C/C280 sample, 45 and 37 ELDOR flip pulse angles were used for the 30 and 50% (v/v) d8-glycerol samples, respectively; for the T240/C280 sample, the corresponding number of flip angles was 43 and 44, respectively. The total measurement time for each complete ELDOR pulse flip angle series was about 30 hrs. Full experimental details of sample preparation and data acquisition, including examples of raw and baseline corrected DEER curves are provided in the Supporting Information text and Figure S4.