Figure 3.

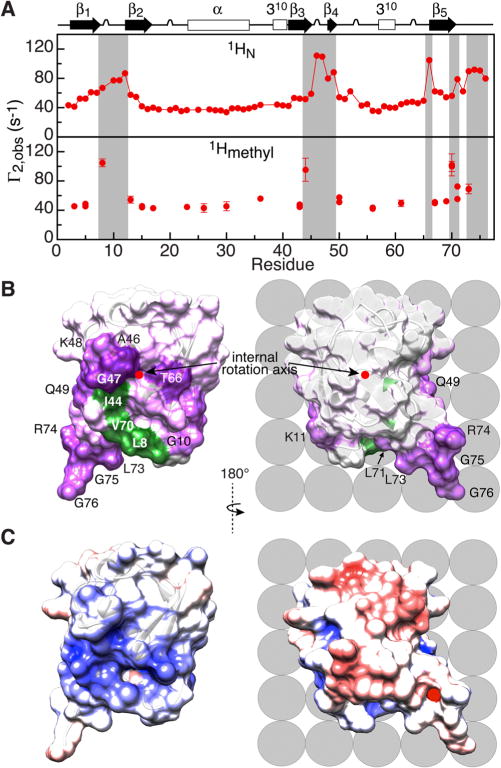
Proton intermolecular transverse PREs (Γ2) observed for U-[15N/2H]/[1Hmethyl/13Cmethyl-ILV] ubiquitin in the presence of negatively charged Gd3+-tagged POPG LUVs. (A) 1H-Γ2 profiles for backbone amide (top) and Ile/Leu/Val methyl (bottom) protons. (B) PRE mapping of the interaction surface of ubiquitin. The internal rotation axis (red dot) is perpendicular to the plane of the figure and orthogonal to the view shown in Figure 2A. 1HN-Γ2 PREs are color-coded from purple (110 s−1) to white (background = 40 s−1), and residues with 1HN-Γ2 ≥ 77 s−1 are labeled; residues with large (>80 s−1) 1Hmethyl-Γ2 values are colored in green. (C) Molecular surface of ubiquitin (same views as in panel B) color-coded according to electrostatic potential (±5 kT with blue, positive; white, neutral; and red, negative). Lipid molecules on the nanoparticle surface are shown schematically as gray spheres.
