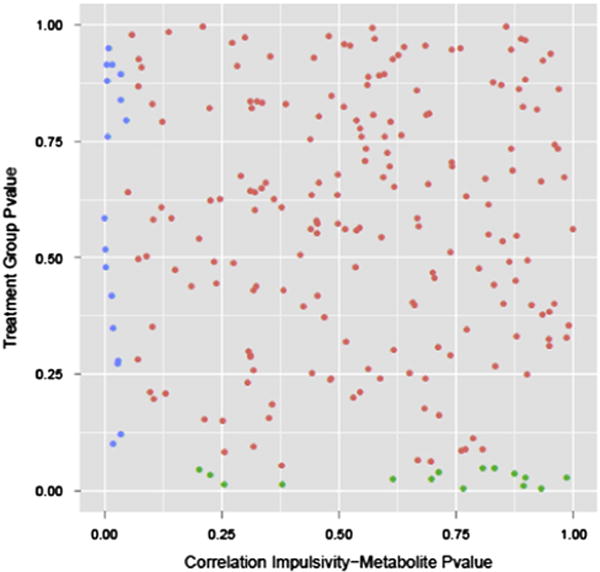
Fig. 3.

Scatter plot of p value of all metabolites testing for the fluoxetine treatment effect (y axis) and correlation with impulsive response (x axis). Each dot represents one metabolite. Green and blue are metabolites significantly associated with fluoxetine treatment and impulsive behavioral effect reaction, respectively (n=8 controls, n=8 fluoxetine). (For interpretation of the references to color in this figure legend, the reader is referred to the web version of this article.)
