
Fig. 6.
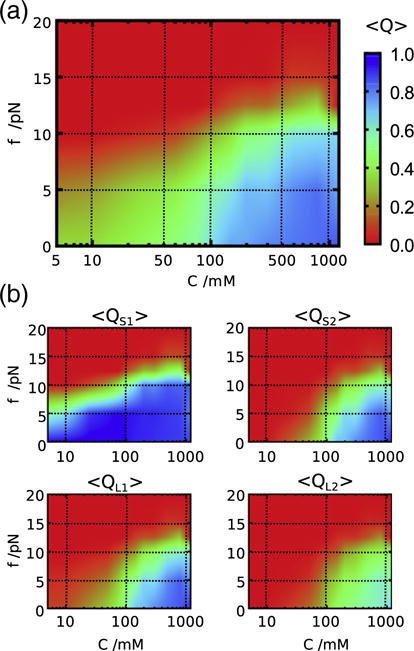
[C, f] phase diagram using the fraction of native contacts as the order parameter. (a) The diagram of states determined using an average of the total Q for the PK. The scale is given on the right. (b) Decomposition of Q into stems and loops: S1, stem 1; S2, stem 2; L1, loop 1; L2, loop 2.