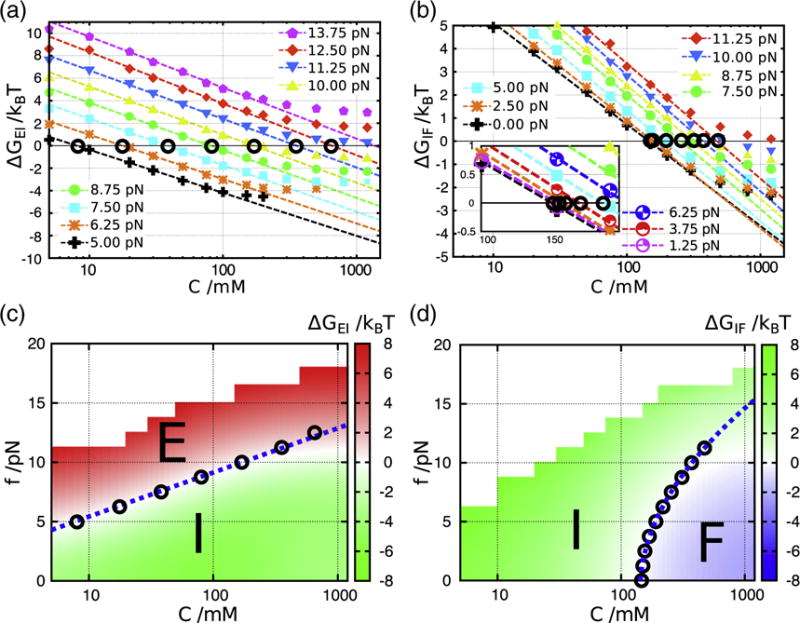
Fig. 8.

Free energy differences between E and I, and I and F calculated from REMD simulations. The definition of states, E, I, and F, is based on the HB interaction energies associated with each structural element (see main text for details). The I state is analogous to I2 in Fig. 3. (a and b) Salt concentration dependences of ΔG is plotted for different force values (symbols are explained in a and b, respectively). (c) ΔGEI is shown on the [C, f] plane, and phase boundary is quantitatively described (white zone between red and green regions). The blue dashed line is the theoretical prediction where log Cm [Eq. (4)]. Circles (°) indicate conditions with ΔGEI=0 extracted from linear dependence of ΔG on log C in (a). It should be noted that the E state is under tension and hence is different from the unfolded state upon thermal melting at f = 0. (d) Same as (c), except the results describe I⇌F transition. Here, the critical force describing the phase boundary is a nonlinear function of log Cm [Eq. (6)].
