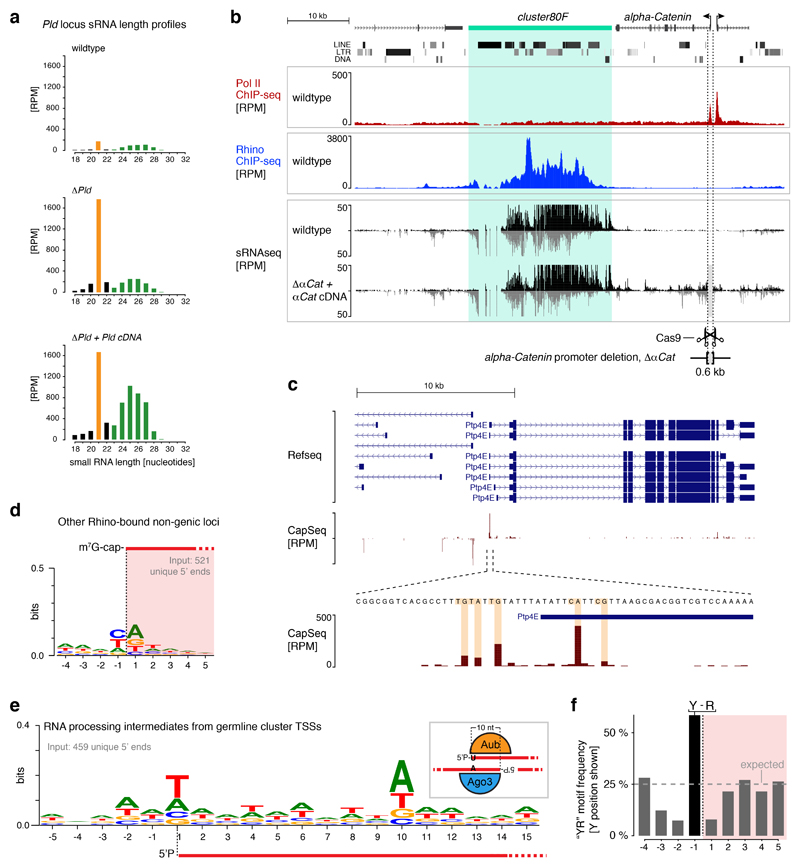
Extended Data Figure 1. Characterization of transcription initiation events at piRNA clusters.
a, Size profile histograms of small RNAs mapping to the Pld gene locus from ovaries with indicated genotypes. siRNAs (21 nt) are highlighted in orange and piRNAs (23-29 nt) are highlighted in green. b, UCSC genome browser panels showing cluster80F for which flanking promoter dependency was investigated by deletion of the promoter region of alpha-Catenin. Shown are Pol II occupancy (red), Rhino occupancy (blue) and piRNA levels (black/grey). Flanking transcription units are shown in grey, light grey shading indicates the experimental promoter deletion. As alpha-Catenin is an essential gene, a cDNA rescue transgene was expressed from another locus. c, UCSC genome browser panels showing the CapSeq profile at the promoter of a canonical gene. d, DNA sequence motif at 5' ends of capped RNAs mapping to Rhino-bound genomic loci (Rhino ChIPseq RPKM > 300; cluster80F and 42AB excluded) outside of known transcription units. e, DNA sequence motif at 5' ends of 5'-monophosphorylated RNAs mapping to cluster42AB or cluster80F. The schematic to the right shows how the ‘ping-pong’ amplification loop involving Aub and Ago3-mediated cleavages gives rise to the observed sequence biases at position +1 and +10. f, Histogram of the ‘YR’ dinucleotide occurrence around cluster42AB and cluster80F transcription start sites (expected chance occurrence: 25%).

