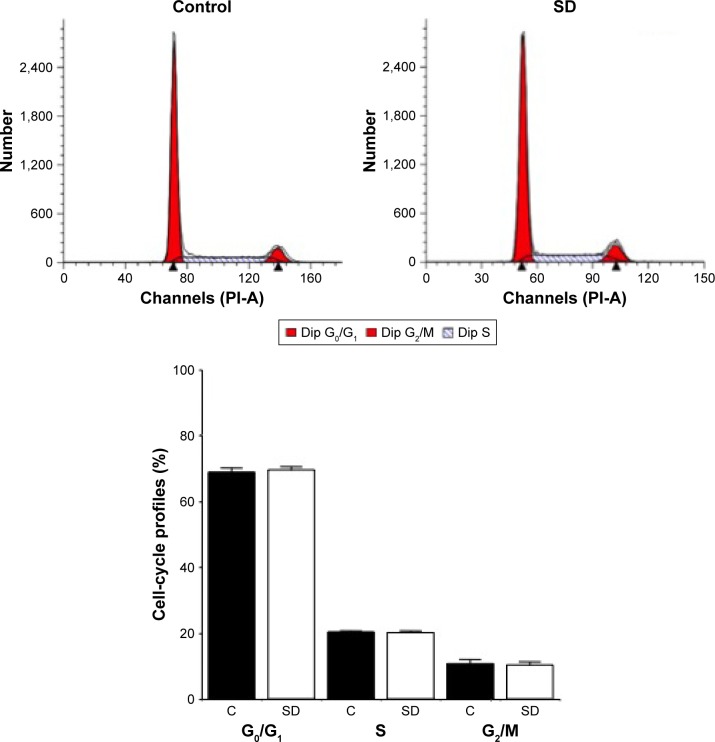
Figure 3.
Effect of SD1029 on the cell-cycle profile of AtT20 cells.
Notes: Control cells were treated with the medium and vehicle. Representative graphs are shown in the upper panels. Duplicate cell treatments were conducted, and the average of three independent experiments is shown in the lower panel. Unpaired Student’s t-tests were conducted to determine differences between treatment means. Cells were incubated for 24 hours with 10 µM SD1029 (SD) or the dimethyl sulfoxide control (C). Cellular DNA content was analyzed by flow cytometry, and cell-cycle profiles were determined using BD FACSDiva software.

