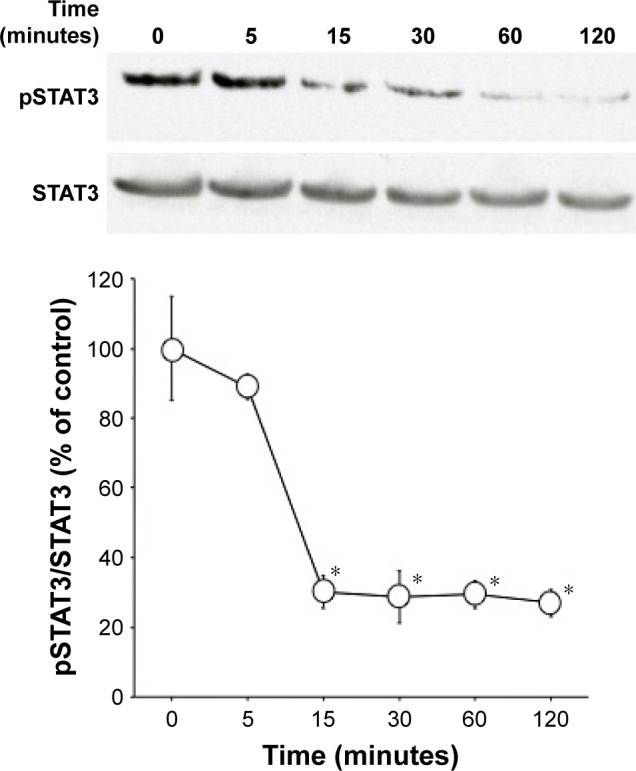
Figure 6.

Time-dependent changes in SD1029-induced STAT3 phosphorylation.
Notes: AtT20 cells were incubated with medium containing 10 µM SD1029 for the durations shown. Cells treatments were conducted in duplicate, and the average of three independent experiments is shown. One-way ANOVA was conducted, followed by Fisher’s protected least significant difference post hoc test to determine differences between treatment means (*P<0.05 compared with control [0 minutes]).
