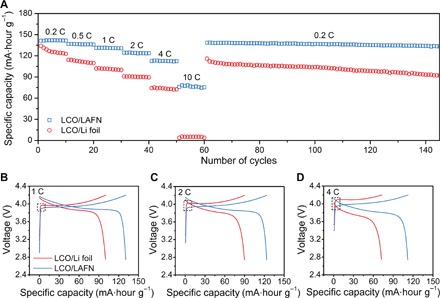
Fig. 5. Electrochemical performance of LCO/LAFN cells.

(A) Rate capability of LCO/LAFN cells and LCO/Li foil cells at various rates from 0.2 to 10 C. (B to D) Voltage profile comparison between LCO/LAFN cells and LCO/Li foil cells at rates of 1 C (B), 2 C (C), and 4 C (D). The dotted boxes are enlarged in fig. S23 (A to C).
