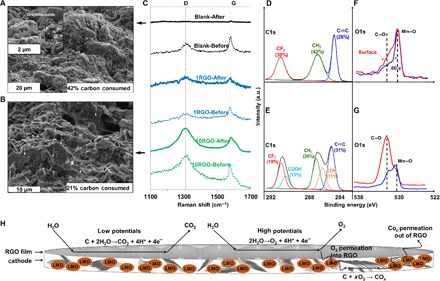
Fig. 4. The morphology of cathode surface, concentration of carbon, and oxidation state of the graphitic carbon particles before and after the cycling stability test.

SEM images of the Blank (A) and 10RGO-coated (B) cathodes. (C) Raman spectra of the Blank and 1RGO and 10RGO cathodes after the cycling test. C1s (D and E) and O1s (F and G) high-resolution XPS spectra of the Blank cathode before and after the cycling test. a.u., arbitrary units. (H) Schematic of O2 and CO2 evolution and permeation on the surface and inside a RGO-coated cathode.
