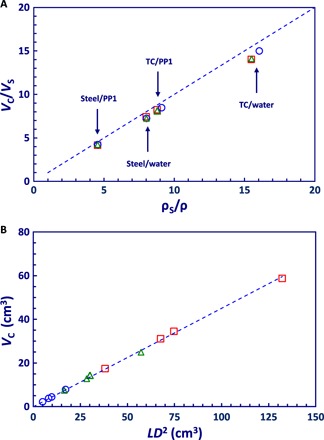
Fig. 2. Cavity volume variation.

(A) Dependence of the cavity-to-sphere volume ratio VC/VS on the sphere-to-liquid density ratio ρS/ρ. Data are for 10-mm (blue circles), 15-mm (green triangles), and 20-mm (red squares) steel (ρS = 7.7 g/cm3) or tungsten carbide (TC) (ρS = 14.9 g/cm3) spheres falling in PP1 (ρ = 1.7 g/cm3) and 95°C water (ρ = 0.96 g/cm3). The dotted line corresponds to neutral buoyancy of the sphere-in-cavity structure. (B) Cavity volume, as a function of (LD2), cavity diameter D, and length L, for the same sphere sizes and liquid combination as in (A). The dotted line is the best linear fit to the data that gives the relation VC ≈ 0.45 LD2.
