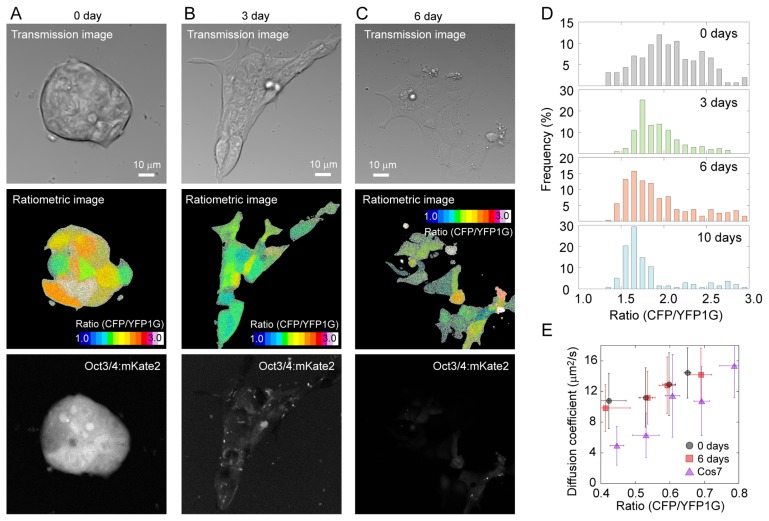
Figure 1.
Live cell imaging of mES cells expressing GimRET. (A–C) Images of undifferentiated mES cells (A, with LIF), mES cells after 3 days of differentiation (B, 3 days after LIF removal), and mES cells after 6 days of differentiation (C, 6 days after LIF removal). mES cells were transfected with GimRET. Top panels, transmission images; middle panels, ratiometric images; bottom panels, Oct3/4 expression reporting mKate2 fluorescence images. The CFP/YFP1G ratio was calculated by dividing the data from the CFP channel (467–499 nm) by data from the YFP1G channel (510–560 nm) in each pixel. (D) Histogram of the intensity ratio of the GimRET during differentiation. (E) The relation between the ratio and the diffusion coefficient obtained by MP-FRAP of mES cells at 0 (circles) and 6 days (squares) after the removal of LIF, and that of COS7 cells (triangles). N=66, 52, and 41 cells, respectively. Error bars denote standard deviation.

