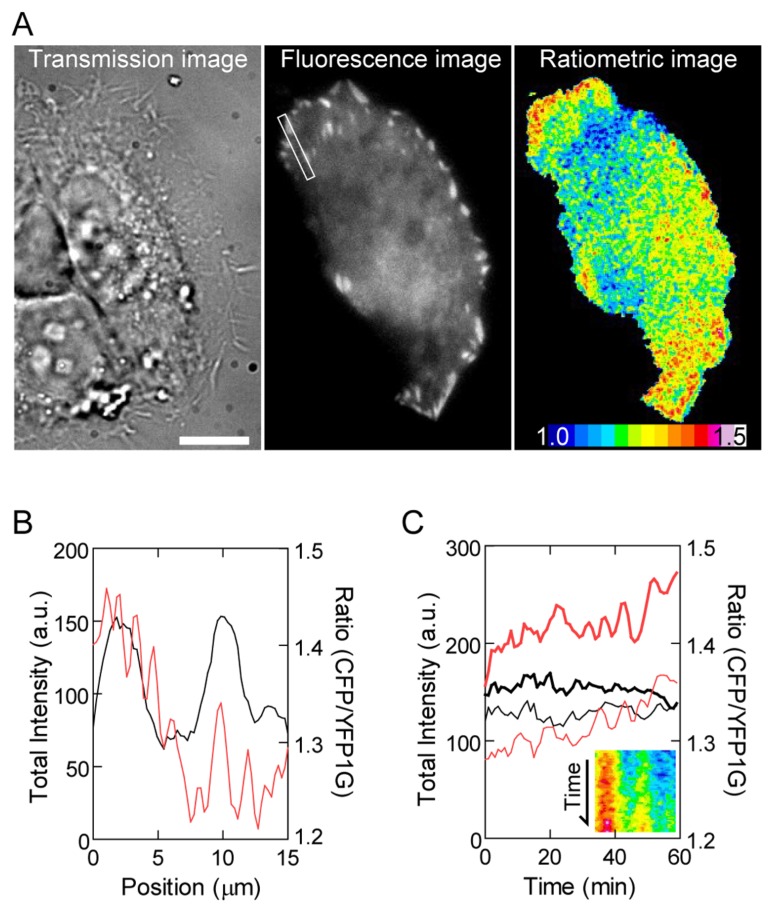
Figure 3.
(A) Transmission (left), total fluorescence (center), and ratiometric images (right) of HeLa cells transfected with GimRET-vinculin. Scale bar, 10 μm. (B) Line profiles of total fluorescence intensity (black) and the ratio (red) along the rectangular region indicated in panel A. (C) Total fluorescence intensity (black) and the ratio (red) within focal adhesion in the cell periphery (bold curve) and inside the cell (solid curve) are plotted against time. The inset shows a kymograph of the ratio profile in the rectangular region indicated in panel A.

