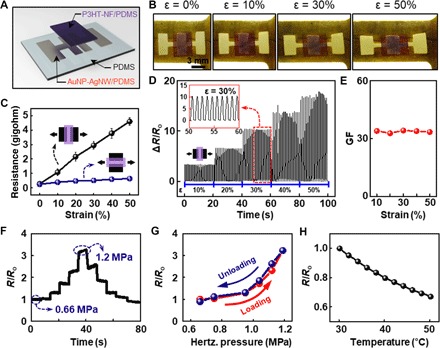
Fig. 3. Rubbery strain, pressure, and temperature sensors.

(A) Exploded schematic illustration of the strain sensor. (B) Photographs of the sensors under different levels of mechanical strain. (C) Measured electrical resistance of the strain sensor under different levels of mechanical strain along the channel length direction (black) and perpendicular to the channel length direction (blue). (D) Relative change of the resistance (ΔR/Ro) under cyclic stretching and releasing. (E) GF of the strain sensor with respect to the different strain. (F) Relative electrical resistance (R/Ro) change of the pressure sensor with respect to time under different levels of pressure. (G) Relative electrical resistance change of the pressure sensor under a loading (red) and unloading (blue) cycle. (H) Relative electrical resistance change of the temperature sensor with respect to the different temperature.
