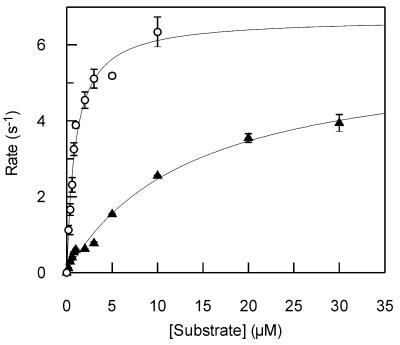
Figure 1.
Steady-state reactions. Steady-state reactions were performed by monitoring the fluorescence of 2-aminopurine-containing substrates (Table 1) after addition of UDG (Materials and Methods). Rates were determined from the initial increase in fluorescence at different concentrations of substrates. The observed rates are shown plotted against concentration for substrates 1U (open circles) and 2U (closed triangles). The solid lines are the best fit of the data to the Michaelis–Menten equation, with the values shown in Table 3.

