. 2017 Sep 8;6:e26509. doi: 10.7554/eLife.26509

Figure 4. Involvement of Fzd and Dvl proteins in Kif26b degradation.

(A) Flow cytometry histograms depicting the effect of ectopic Shisa2 expression on the ability of Wnt5a to induce GFP-Kif26b degradation in the WRK reporter assay. Mouse Shisa2 was expressed via lentiviral transduction. A lentivirus expressing Cas9 was used as the control. The effect of Wnt5a or control buffer treatment on the WRK reporter line without virus infection is shown as a reference. (B) Quantification of effects of the control virus (Cas9) and the Shisa2 virus on the ability of Wnt5a to downregulate the GFP-Kif26b fluorescence in the WRK reporter assay, as shown in (A). Error bars represent ± SEM calculated from three technical replicates. t-tests were determined for the following comparisons: control virus vs. Shisa2 virus, p<0.001; control virus vs. no virus, p=0.0957 (not significant). (C) Flow cytometry histograms depicting the effect of ectopic Fzd1 or Fzd7 expression on GFP-Kif26b levels in the WRK reporter assay. Mouse Fzd1 and Fzd7 were expressed via lentiviral transduction. A lentivirus expressing Cas9 was used as the control. (D) Quantification of the median GFP-Kif26b fluorescence in the WRK reporter cell line infected with a Fzd1 virus, a Fzd7 virus, or a Cas9 control virus. Error bars represent ± SEM calculated from six technical replicates. t-tests were determined for the following comparisons: control virus vs. Fzd1 virus, p<0.001; control virus vs. Fzd7 virus, p<0.001. (E) Flow cytometry histograms depicting the effect of ectopic Dvl1 expression on GFP-Kif26b levels in the WRK reporter assay. Dvl1 was expressed via lentiviral transduction. A lentivirus expressing Cas9 was used as the control. (F) Quantification of the median GFP-Kif26b fluorescence in the WRK reporter cell line infected with a Dvl1-expressing virus, or a Cas9-expressing control virus. Error bars represent ± SEM calculated from three technical replicates. t-test was determined for control virus vs. Dvl1 virus, p<0.001.

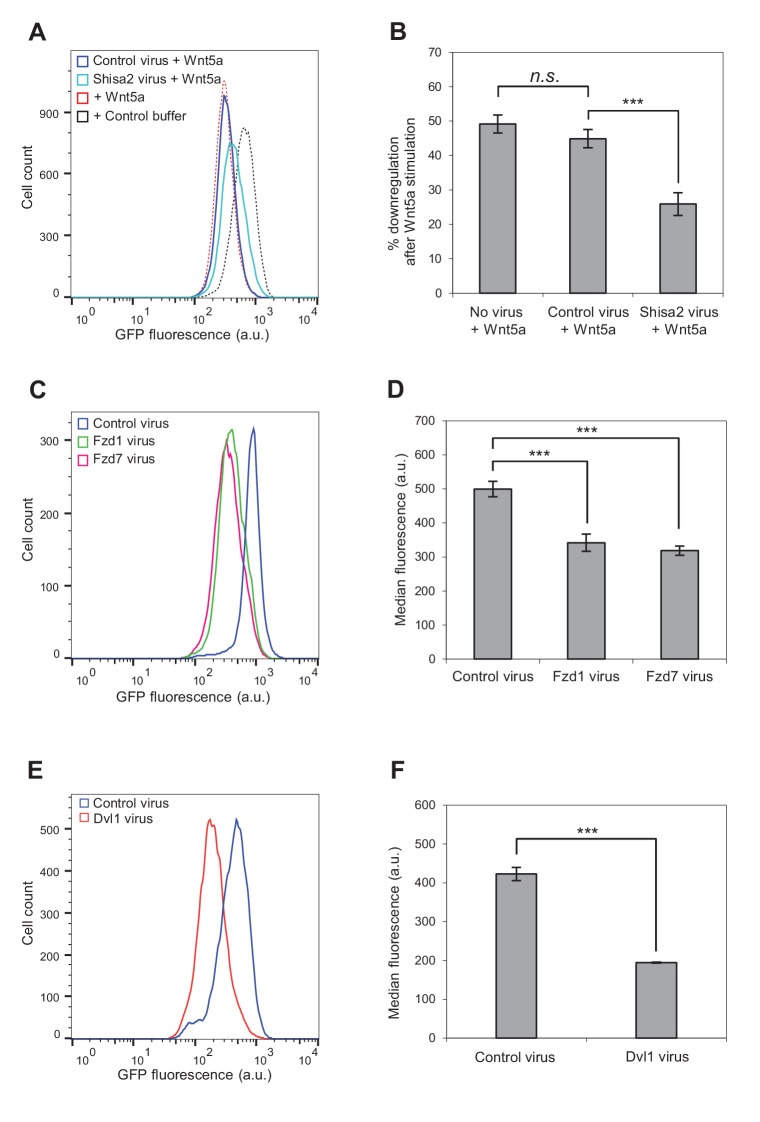
Figure 4—source data 1. (Related to panel B) The effects of the control virus and the Shisa2 virus on the ability of Wnt5a to downregulate GFP-Kif26b fluorescence in the WRK reporter assay.
DOI: 10.7554/eLife.26509.016
Figure 4—source data 2. (Related to panel D) The median GFP-Kif26b fluorescence in the WRK reporter cell line infected with a Fzd1 virus, a Fzd7 virus, or a Cas9 control virus.
DOI: 10.7554/eLife.26509.017
Figure 4—source data 3. (Related to panel F) Quantification of the median GFP-Kif26b fluorescence in the WRK reporter cell line infected with a Dvl1 virus or a Cas9 control virus.
DOI: 10.7554/eLife.26509.018

Figure 4.

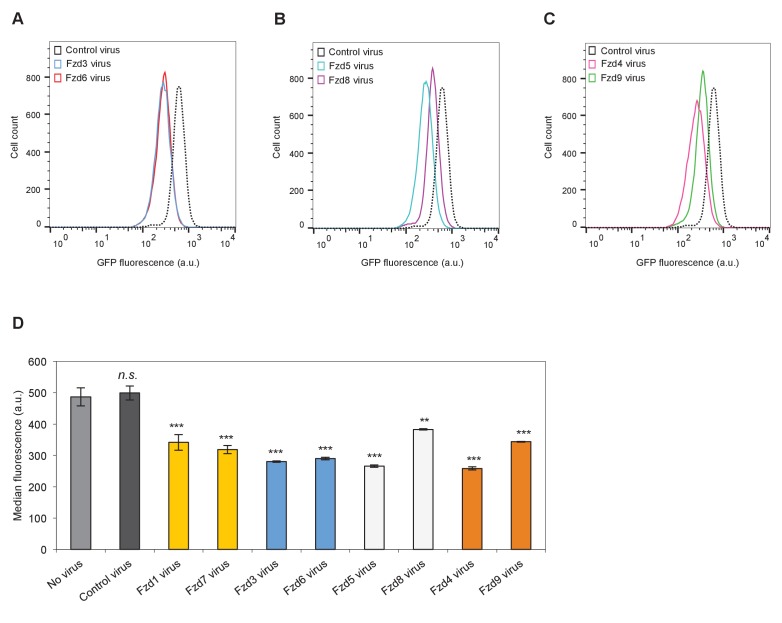
Figure 4—figure supplement 1. Comparison of the abilities of distinct Fzd subfamily members to induce Kif26b degradation.

Figure 4—figure supplement 1.

(A) Flow cytometry histograms depicting the effect of ectopic Fzd3 or Fzd6 expression on GFP-Kif26b levels in the WRK reporter assay. Mouse Fzd3 and Fzd6 were expressed via lentiviral transduction. Histogram from an uninfected WRK reporter cell line is shown as a reference. (B) Flow cytometry histograms depicting the effect of ectopic Fzd5 or Fzd8 expression on GFP-Kif26b levels in the WRK reporter assay. Mouse Fzd5 and Fzd8 were expressed via lentiviral transduction. Histogram from an uninfected WRK reporter cell line is shown as a reference. (C) Flow cytometry histograms depicting the effect of ectopic Fzd4 or Fzd9 expression on GFP-Kif26b levels in the WRK reporter assay. Mouse Fzd4 and Fzd9 were expressed via lentiviral transduction. Histogram from an uninfected WRK reporter cell line is shown as a reference. (D) Quantification of the median GFP-Kif26b fluorescence in the WRK reporter cell line infected with various Fzd viruses shown in (A) – (C). Fzds with the same color bars are part of the same sub-families. WRK reporter lines uninfected or infected with a Cas9 virus are shown as controls. Error bars represent ± SEM calculated from technical replicates. n = 9 for no virus and control viurs. n = 6 for Fzd1 and Fzd7 viruses. n = 3 for all other Fzd viruses. t-tests were determined for the following comparisons: control virus vs. Fzd1 virus, p<0.001; control virus vs. Fzd7 virus, p<0.001; control virus vs. Fzd3 virus, p<0.001; control virus vs. Fzd6 virus, p<0.001; control virus vs. Fzd5 virus, p<0.001; control virus vs. Fzd8 virus, p<0.01; control virus vs. Fzd4 virus, p<0.001; control virus vs. Fzd9 virus, p<0.001; control virus vs. no virus, p=0.3683 (not significant).