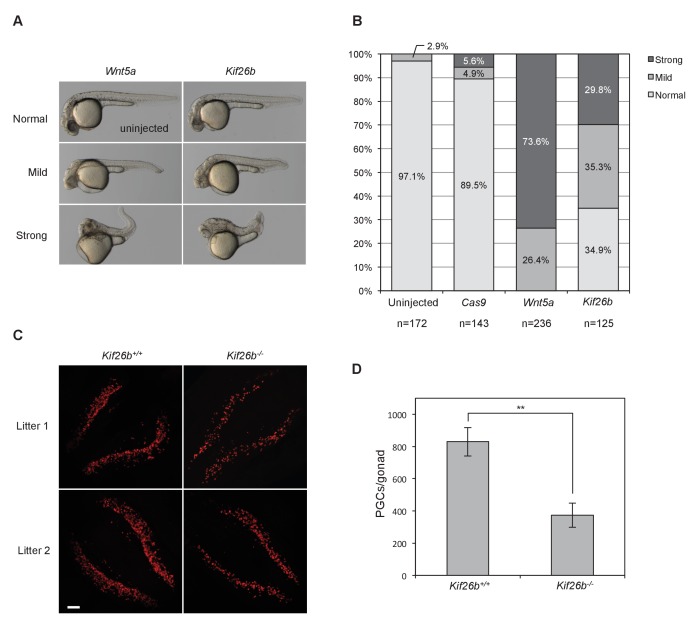
Figure 6. In vivo perturbation of Kif26b expression in zebrafish and mouse embryos induces phenotypes characteristic of Wnt5a-Ror signaling defects.
(A) Representative images showing the effects of Wnt5a and Kif26b mis-expression on zebrafish embryonic tissue morphogenesis. Microinjection of Wnt5a mRNA did not produce any embryos that were scored as ‘normal’, so the image of an uninjected embryo is shown to represent normal embryos. (B) Quantification of the effects of Wnt5a and Kif26b mis-expression on zebrafish embryonic tissue morphogenesis. Images were taken from embryos at 50 hr post fertilization (50 hpf). Data for each experimental condition are pooled from at least three independent injection experiments. (C) Representative images showing immunofluorescence staining of SEAA1 to mark PGCs that have successfully entered the gonads of E11.5 Kif26b+/+ or Kif26b-/- mouse embryos. Scale bar represents 100 μm. (D) Quantification of the numbers of PGCs per gonad in E11.5 Kif26b+/+ or Kif26b-/- mouse embryos. Error bars represent ± SD calculated from independent biological samples (Kif26b+/+, n = 2; Kif26b-/-, n = 4). t-test (unpaired) was determined for Kif26b+/+ vs. Kif26b-/- (p<0.01).

