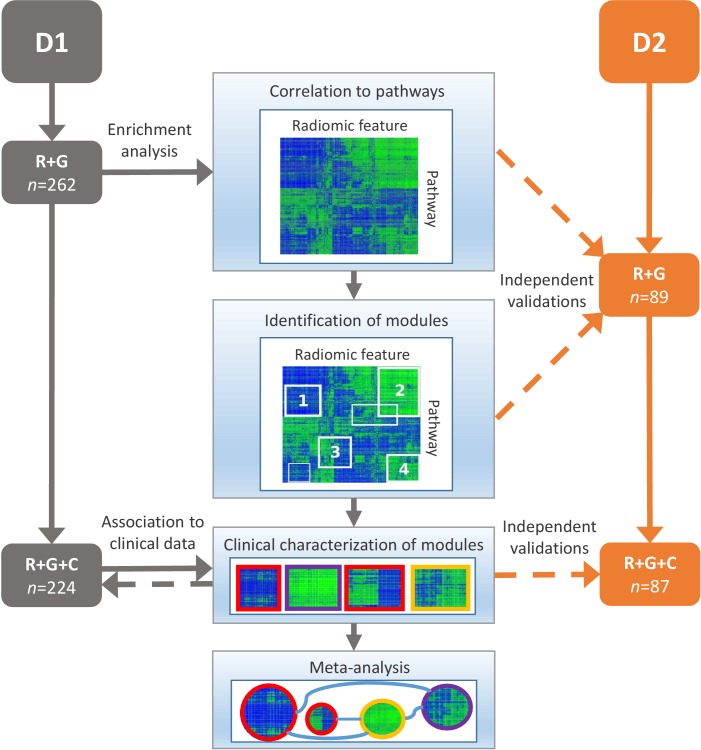
Figure 2. Schema of our strategy to define robust radiomic-pathway-clinical relationships.
Two independent lung cancer cohorts (D1 and D2) with radiomic (R), genomic (G), and clinical (C) data were analyzed. D1 (n = 262) was used as a discovery cohort and D2 (n = 89) was used to validate our findings. A gene set enrichment analysis (GSEA) approach assessed scores for radiomic-pathway associations. These scores were biclustered to modules that contain features and pathways with coherent expression patterns. These modules may overlap and vary in size. Clinical association to overall survival (red), pathologic histology (purple), and TNM stage (yellow) was statistically tested in both datasets, and results were combined in a meta-analysis to investigate relationships of modules.
DOI: http://dx.doi.org/10.7554/eLife.23421.004

