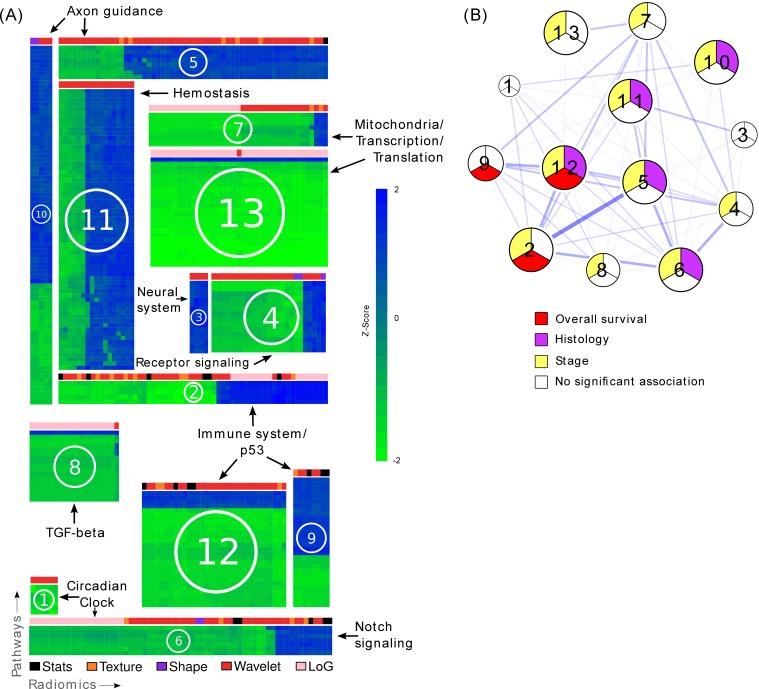
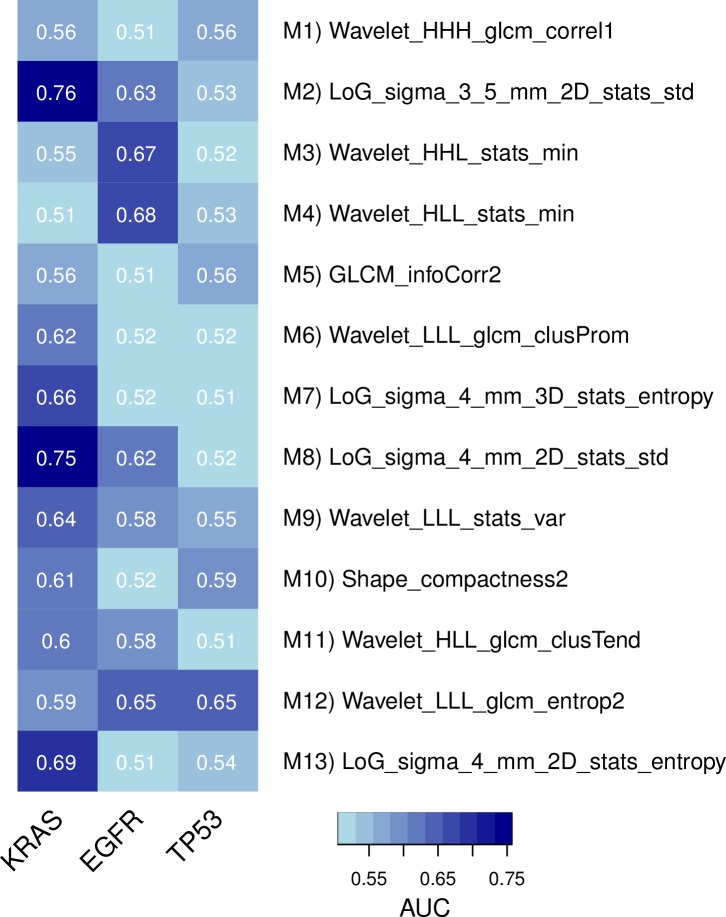
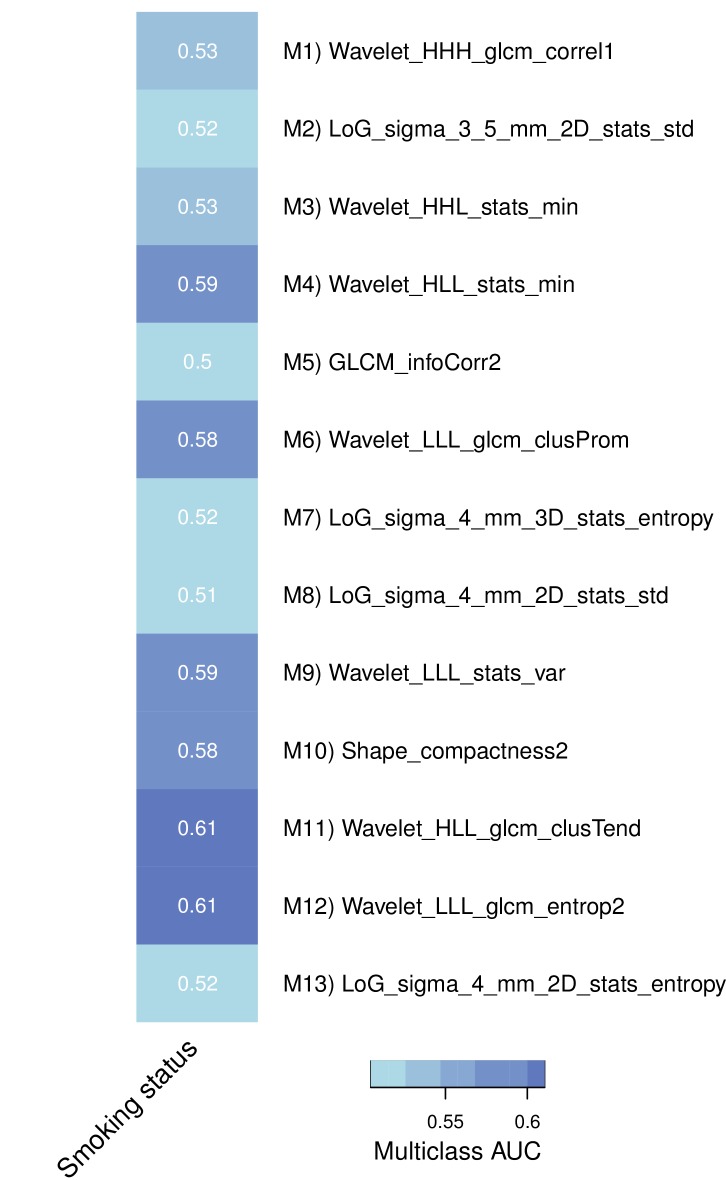
Figure 3. Radiomic-pathway-clinical modules.
(A) Clustering of significantly validated radiomic-pathway association modules (FDR < 0.05). Normalized enrichment scores (NESs) have been biclustered to coherently expressed modules. Every heatmap in this figure corresponds to a module (M1 - M13) with radiomic features in columns and pathways in rows. Heatmap sizes are proportional to module sizes. Elements are NESs given in Z-scores across features, and are displayed in blue when positive and green when negative. Horizontal color bars above every module indicate radiomic feature groups (black = first order statistics, orange = texture, purple = shape, red = wavelet, and pink = Laplace of Gaussian). Representative molecular pathways are displayed. (B) Clinical module network. We investigated if modules were associated with overall survival (red), stage (yellow), histology (purple), or no clinical factor (white). Relationships of modules based on their number of shared radiomic features (thickness of blue lines) are displayed by a network. While we found that most modules yield clinical information, overlaps of modules did not indicate relationships to similar clinical factors.
DOI: http://dx.doi.org/10.7554/eLife.23421.008


