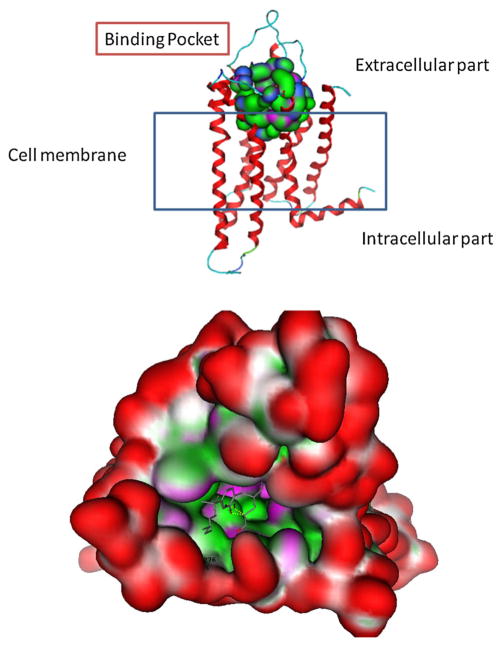
Fig. 4.
Molecular surface analysis of CB2 model. The protein is shown with the N-terminus at the top and the residues forming the binding pocket are shown in space-filling mode among the transmembrane helices and isolated figure as a surface with colour-coded features: H bonding (magenta), lipophilic (green), mild polar (blue)

